- Home >
- Stock Photos >
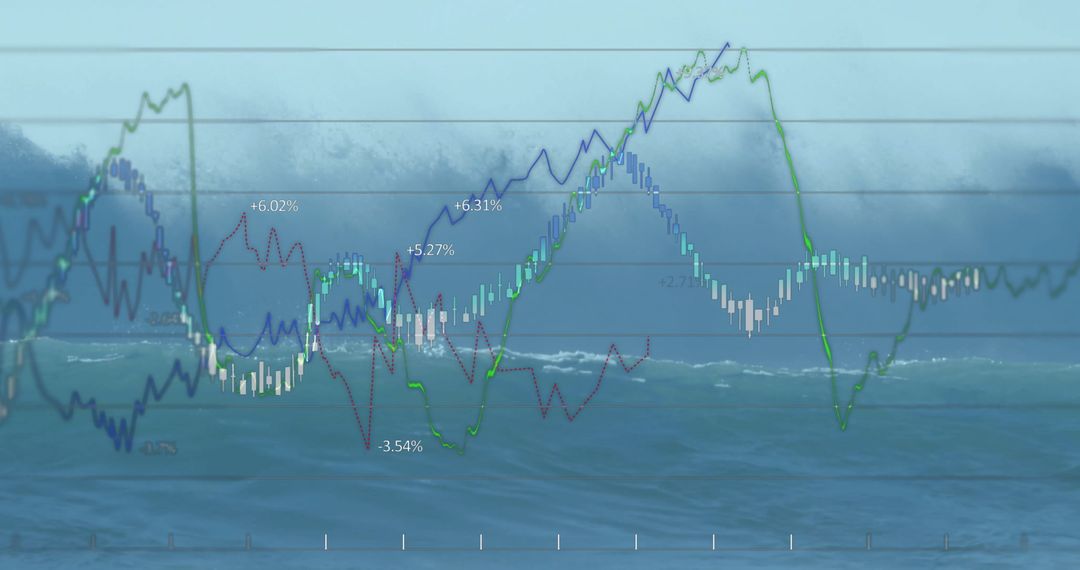
- Hands Holding Money with Overlay of Financial Data and Graphs
Hands Holding Money with Overlay of Financial Data and Graphs Image

Picture showing hands holding currency with graphs overlayed, representing financial data analysis. Ideal for brochures and presentations related to budgeting, economic growth, market investments, or economic strategies.
Powered by 


2
downloads
downloads
Tags:
More
Credit Photo
If you would like to credit the Photo, here are some ways you can do so
Text Link
photo Link
<span class="text-link">
<span>
<a target="_blank" href=https://pikwizard.com/photo/hands-holding-money-with-overlay-of-financial-data-and-graphs/57f35455e5232dc6bdde277342d7b5fc/>PikWizard</a>
</span>
</span>
<span class="image-link">
<span
style="margin: 0 0 20px 0; display: inline-block; vertical-align: middle; width: 100%;"
>
<a
target="_blank"
href="https://pikwizard.com/photo/hands-holding-money-with-overlay-of-financial-data-and-graphs/57f35455e5232dc6bdde277342d7b5fc/"
style="text-decoration: none; font-size: 10px; margin: 0;"
>
<img src="https://pikwizard.com/pw/medium/57f35455e5232dc6bdde277342d7b5fc.jpg" style="margin: 0; width: 100%;" alt="" />
<p style="font-size: 12px; margin: 0;">PikWizard</p>
</a>
</span>
</span>
Free (free of charge)
Free for personal and commercial use.
Author: Awesome Content
Similar Free Stock Images

Premium


Premium


Premium


Premium


Premium


Premium


Premium


Premium


Premium


Premium


Premium


Premium


Premium


Premium


Premium


Premium


Premium


Premium


Premium


Premium


Premium


Premium


Premium


Premium