- Home >
- Stock Photos >
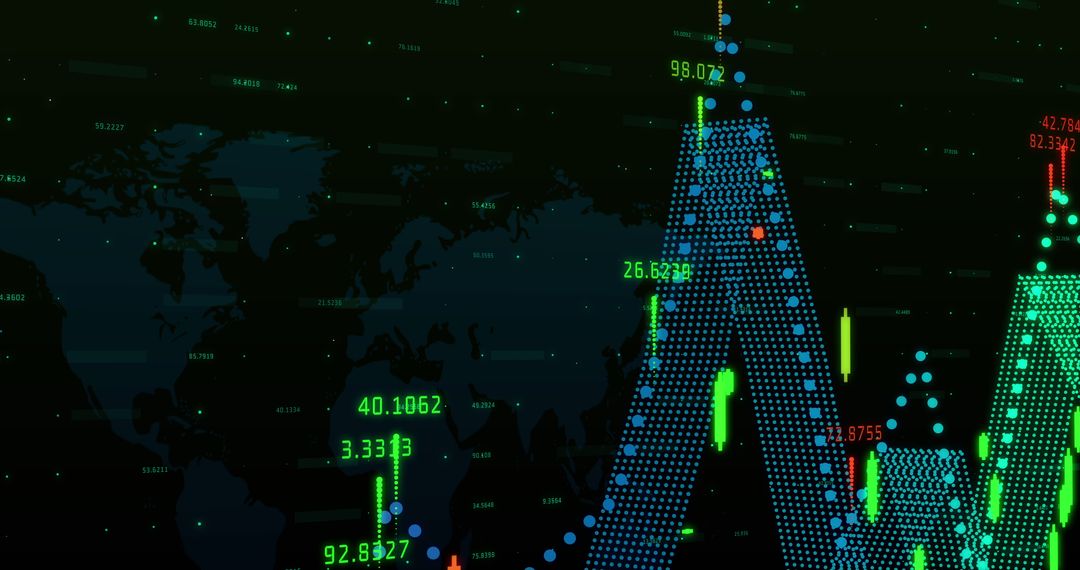
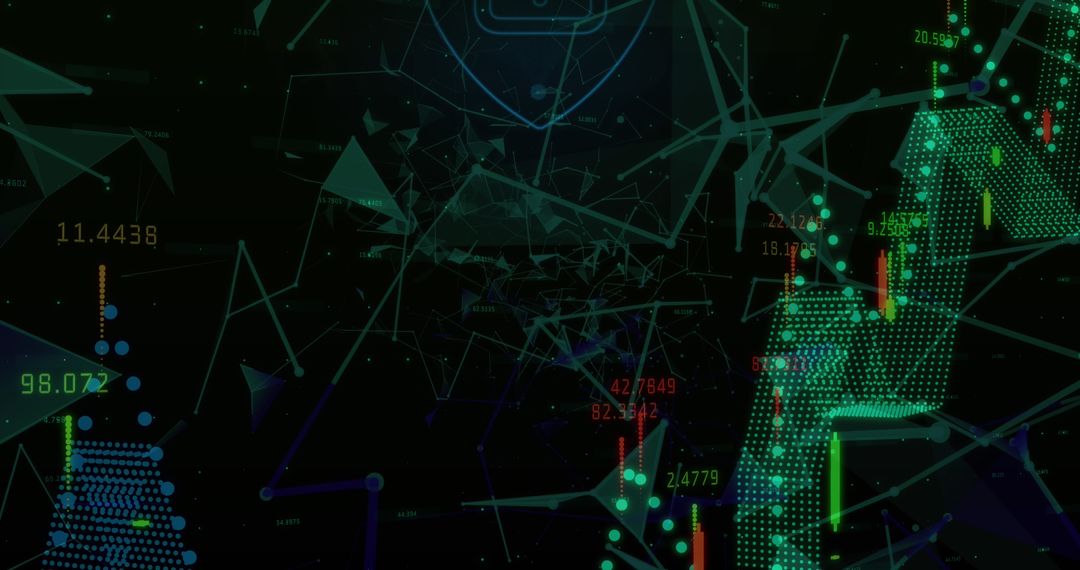
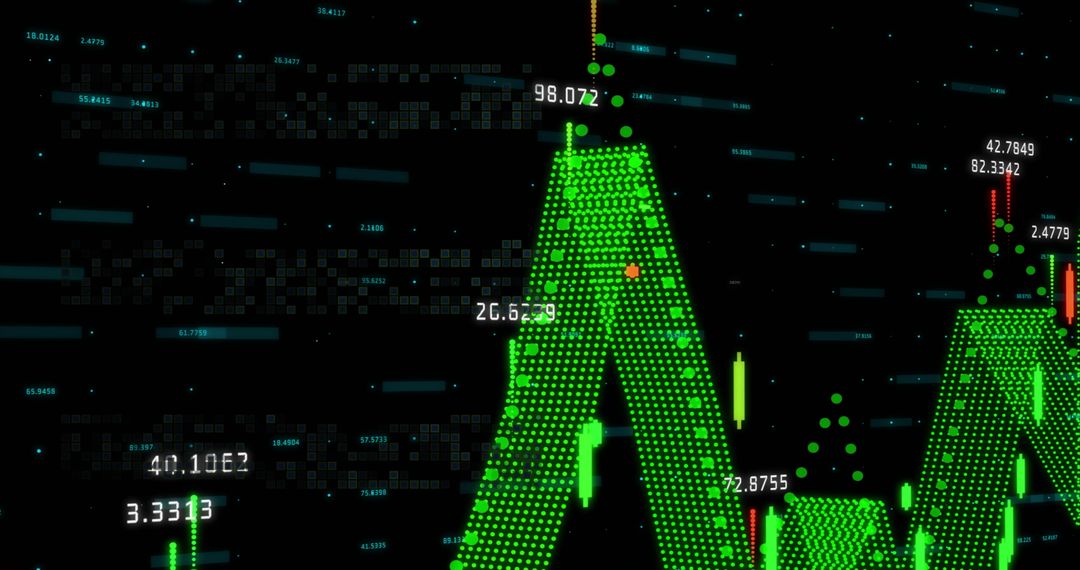
- Holographic Point Cloud Peaks Representing Data Flow and Financial Analytics in Neon Grid
Holographic Point Cloud Peaks Representing Data Flow and Financial Analytics in Neon Grid Image

Graphic showing tall cyan point-cloud peaks rising from dark data field, dotted with glowing numeric labels and candlestick markers. Vertical light streaks and translucent grid layers creating depth and motion, suggesting real-time analytics and market activity. Perfect for illustrating data analytics, fintech platforms, trading dashboards, machine learning presentations, or technology marketing. Working well for headlines, slides, blog posts, white papers, and product pages focused on big data, finance, AI, or cybersecurity. Color palette featuring neon cyan, green, and red accents for high-contrast modern look.
Powered by 


0
downloads
downloads
Tags:
More
Credit Photo
If you would like to credit the Photo, here are some ways you can do so
Text Link
photo Link
<span class="text-link">
<span>
<a target="_blank" href=https://pikwizard.com/photo/holographic-point-cloud-peaks-representing-data-flow-and-financial-analytics-in-neon-grid/5611ab30288b93cce0d8a98d854b7905/>PikWizard</a>
</span>
</span>
<span class="image-link">
<span
style="margin: 0 0 20px 0; display: inline-block; vertical-align: middle; width: 100%;"
>
<a
target="_blank"
href="https://pikwizard.com/photo/holographic-point-cloud-peaks-representing-data-flow-and-financial-analytics-in-neon-grid/5611ab30288b93cce0d8a98d854b7905/"
style="text-decoration: none; font-size: 10px; margin: 0;"
>
<img src="https://pikwizard.com/pw/medium/5611ab30288b93cce0d8a98d854b7905.jpg" style="margin: 0; width: 100%;" alt="" />
<p style="font-size: 12px; margin: 0;">PikWizard</p>
</a>
</span>
</span>
Free (free of charge)
Free for personal and commercial use.
Author: People Creations
Similar Free Stock Images

Premium


Premium


Premium


Premium


Premium


Premium


Premium


Premium


Premium


Premium


Premium


Premium


Premium


Premium


Premium


Premium


Premium


Premium


Premium


Premium


Premium


Premium


Premium


Premium