- Home >
- Stock Photos >
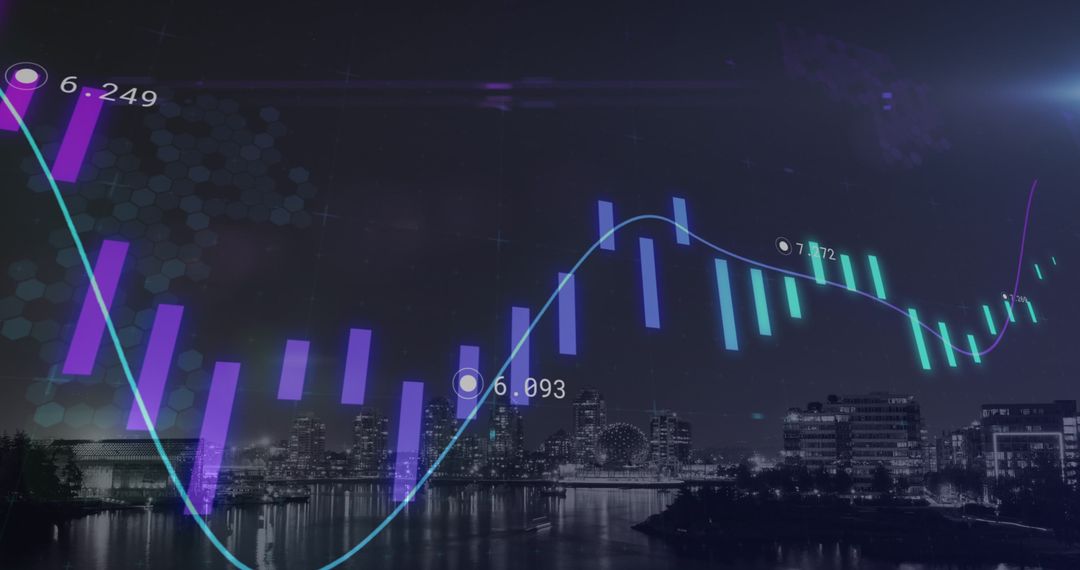
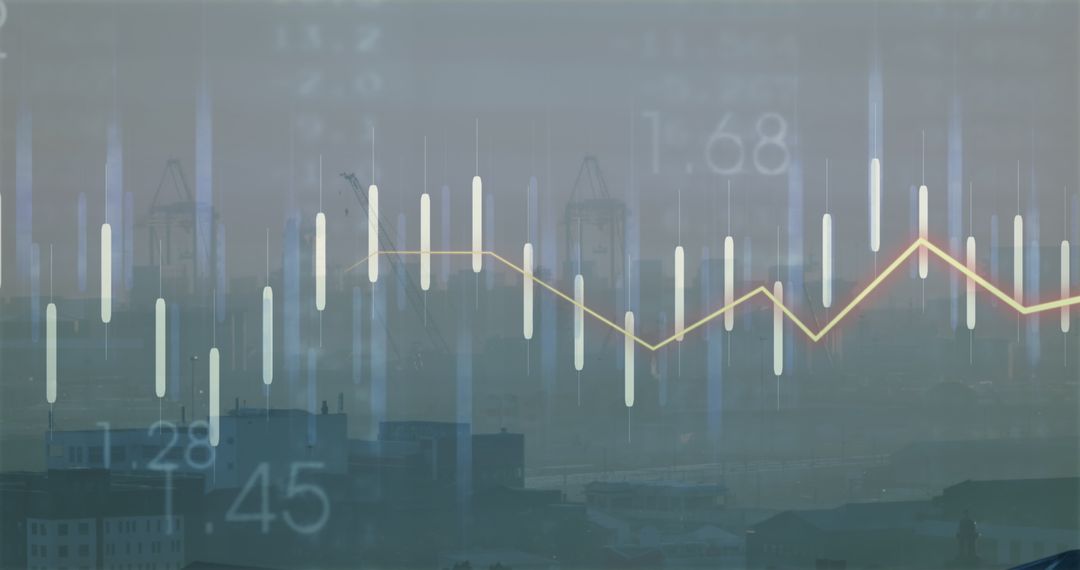
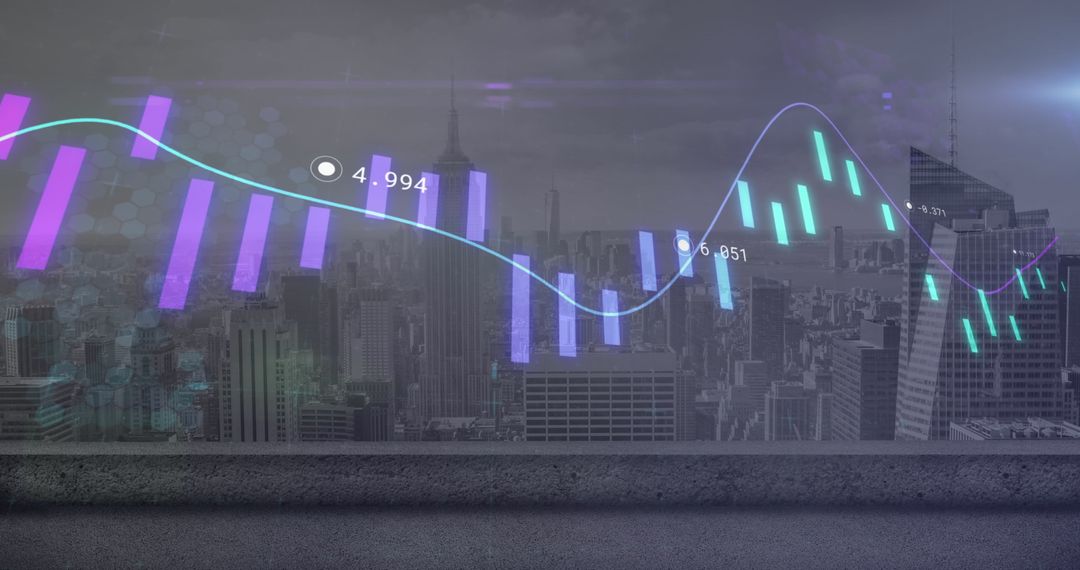
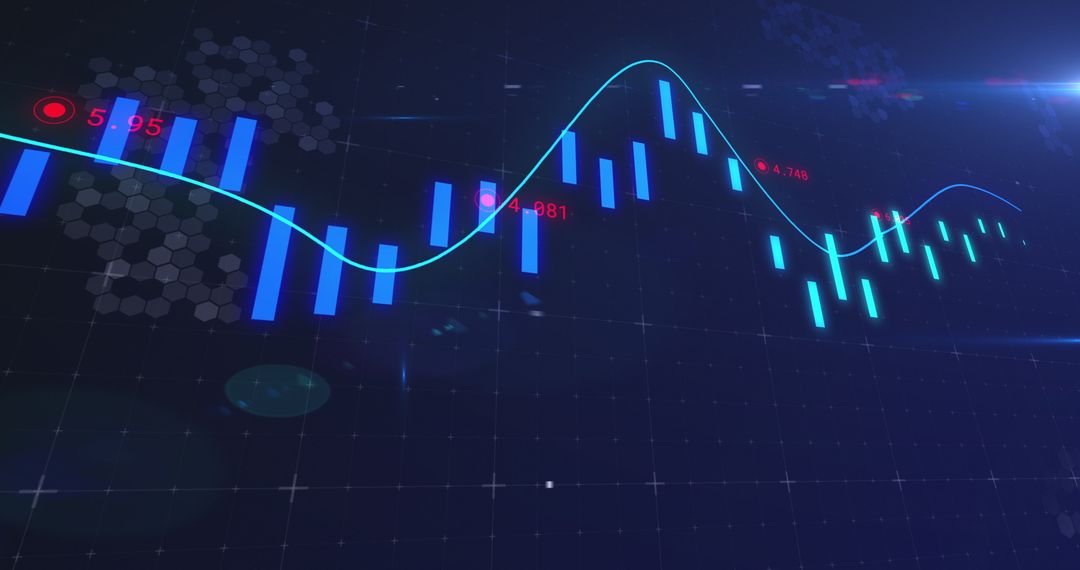
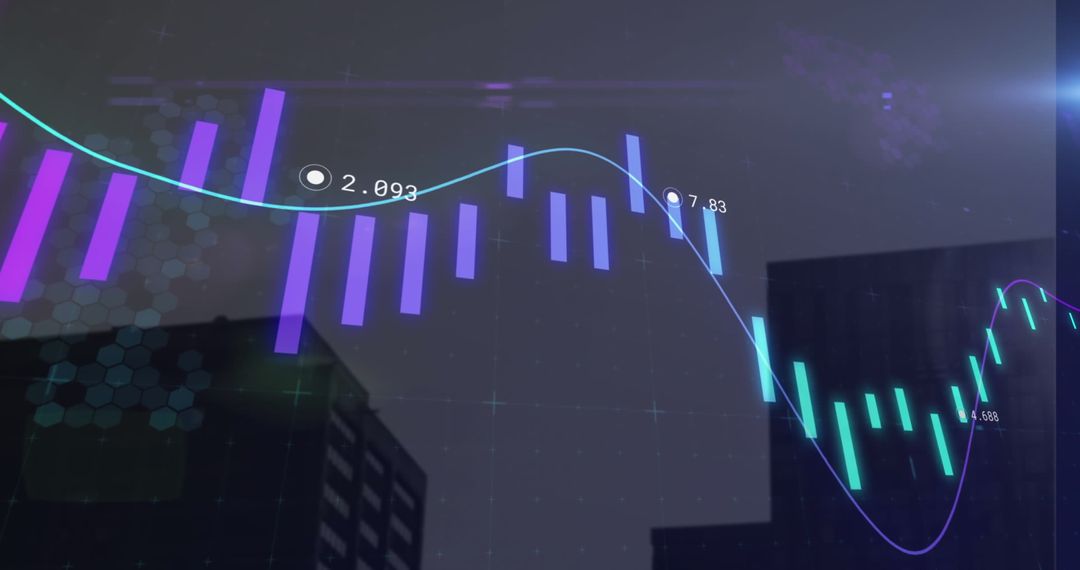
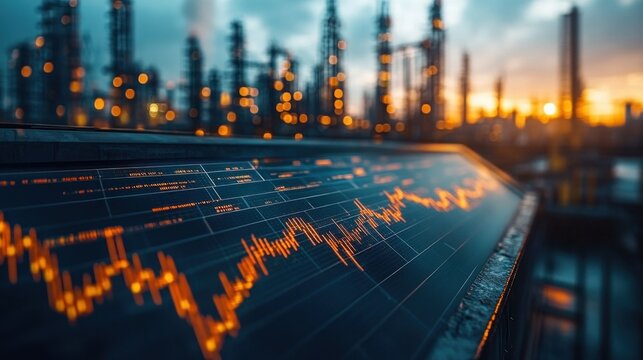
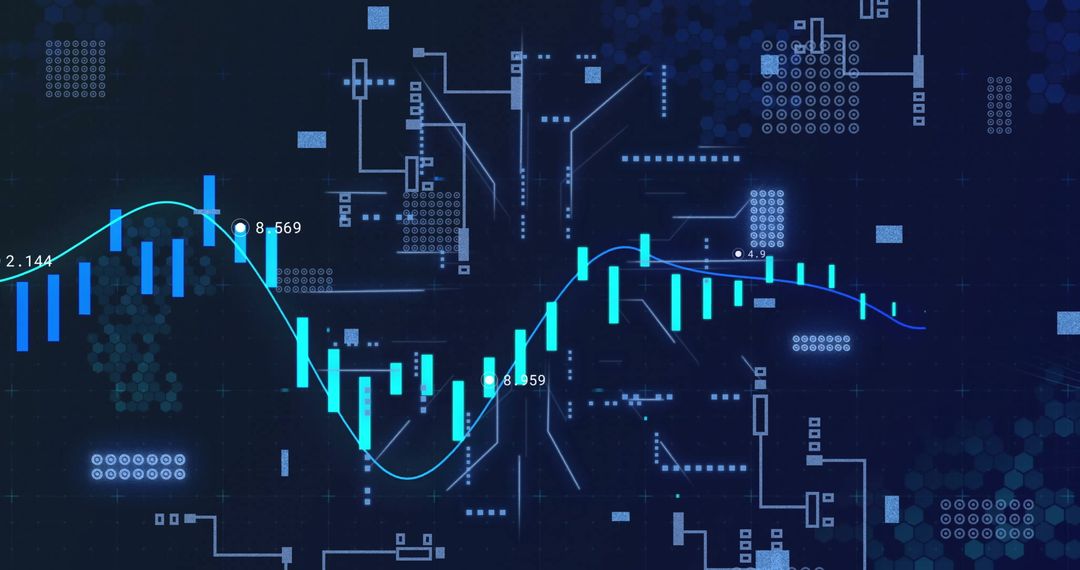
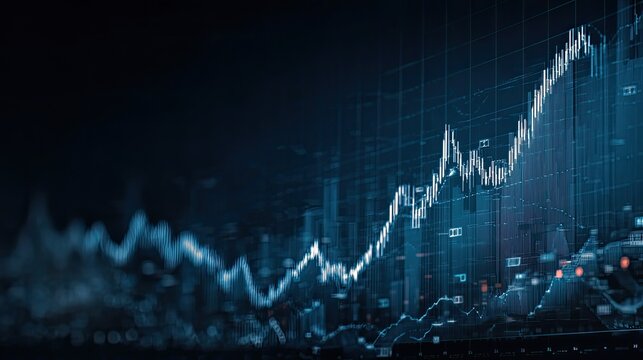
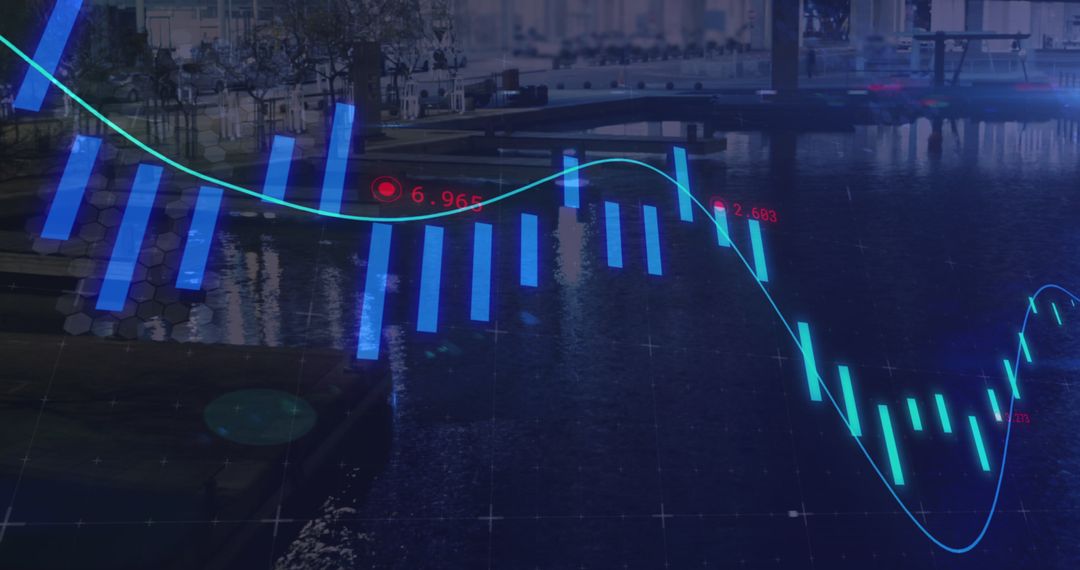
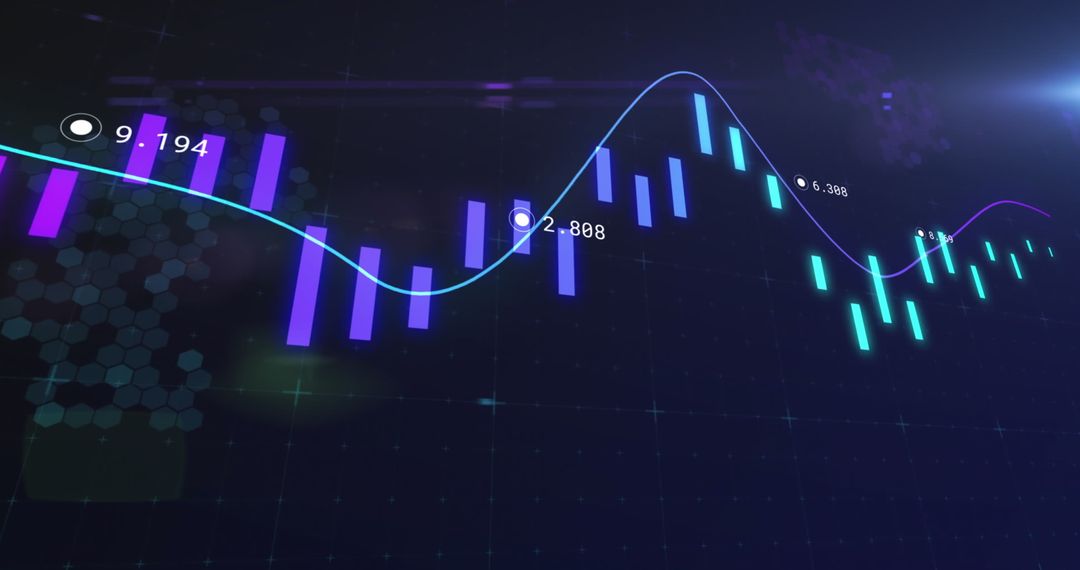
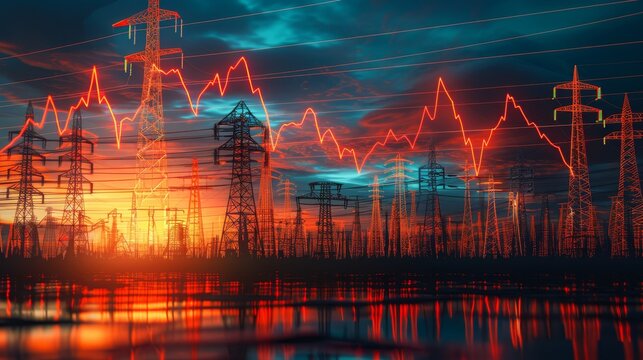
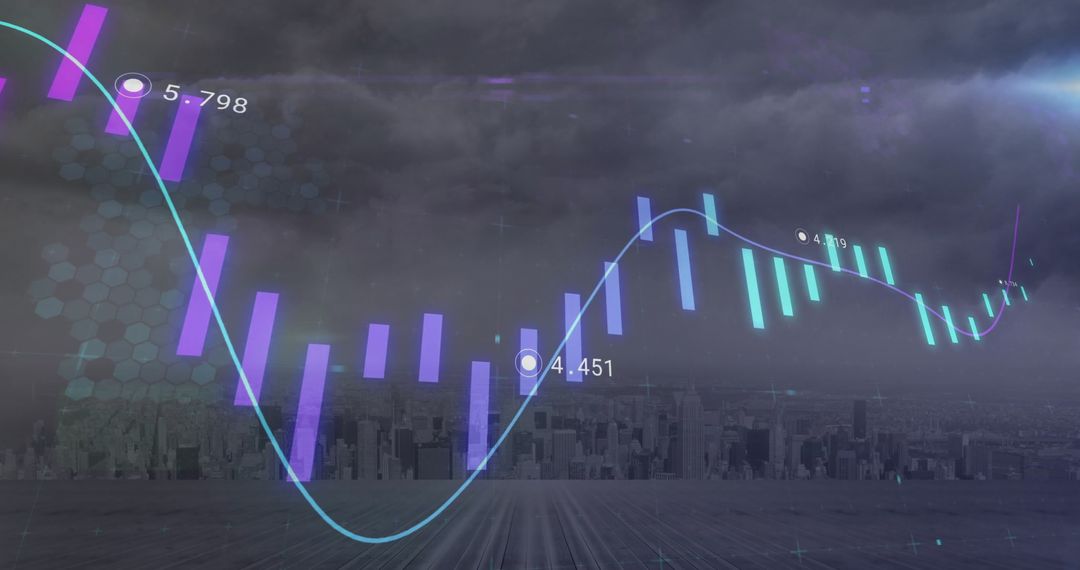
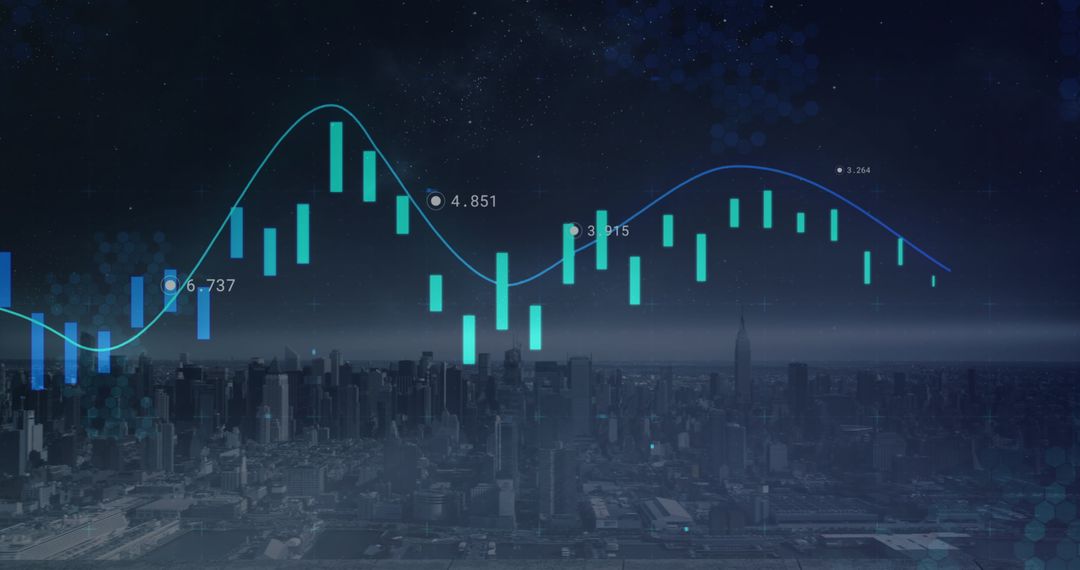
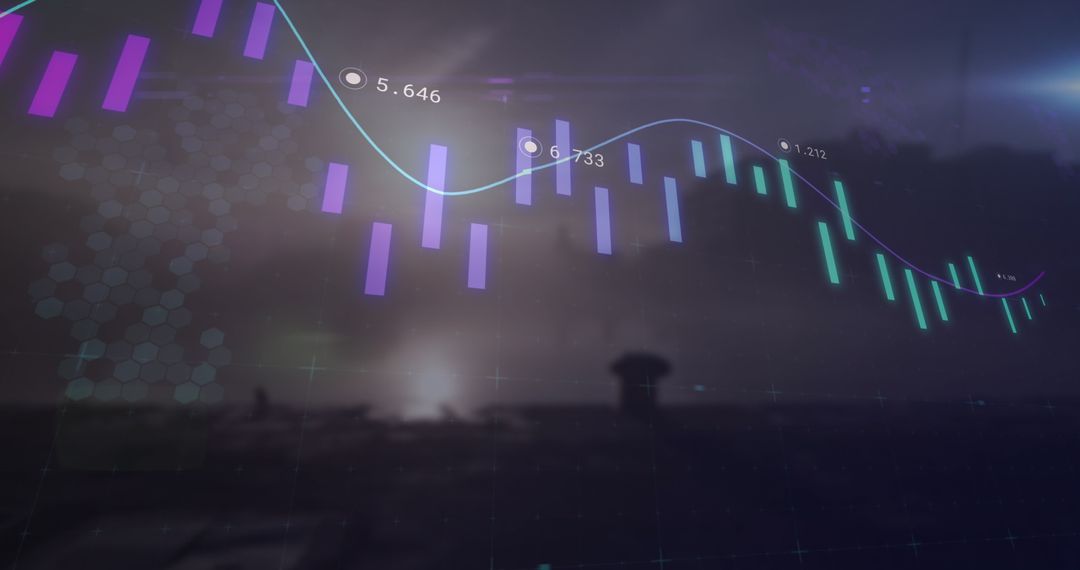
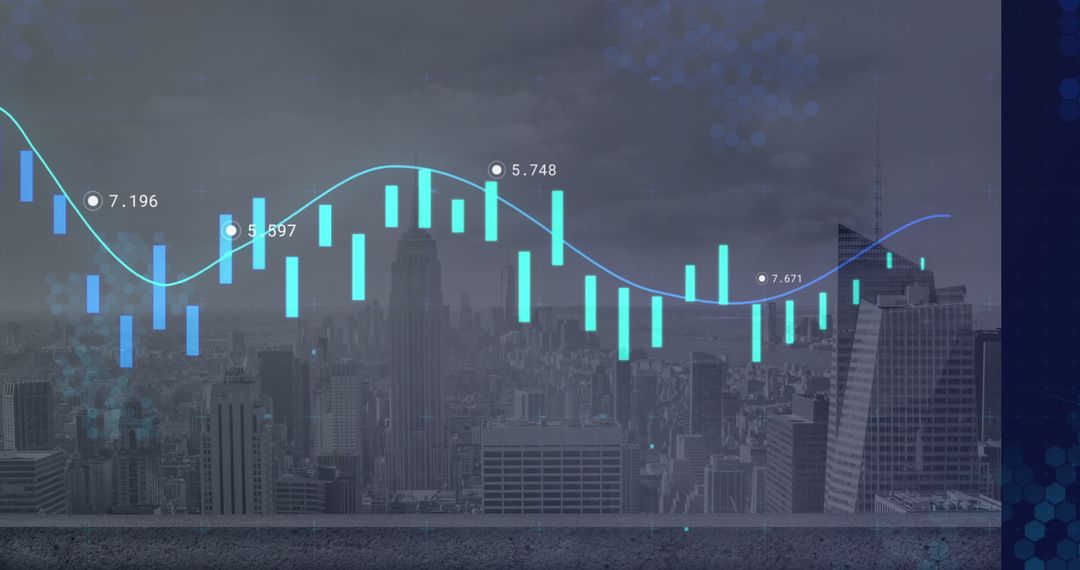
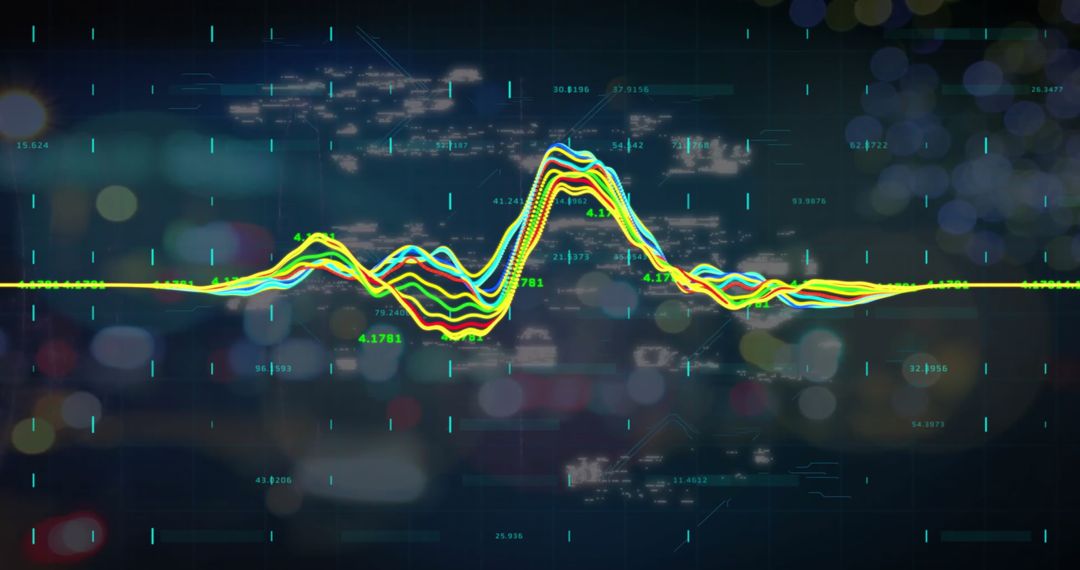
- Industrial Financial Analysis with Performance Graph
Industrial Financial Analysis with Performance Graph Image
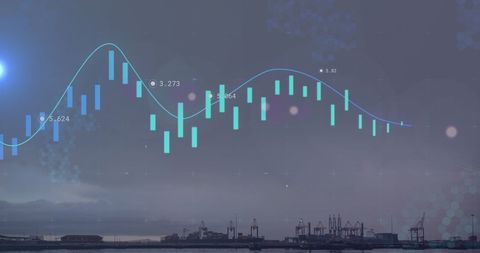
Abstract depiction of financial performance over time featuring a vibrant graph set against an industrial backdrop. Predominant blue and white colors ensure a modern and cool aesthetic, ideal for articles or presentations focused on financial market trends, investment insights, and economic sector analysis. Suitable for use in financial reports, business newsletters, or educational materials regarding market analytics.
Powered by 


2
downloads
downloads
Tags:
More
Credit Photo
If you would like to credit the Photo, here are some ways you can do so
Text Link
photo Link
<span class="text-link">
<span>
<a target="_blank" href=https://pikwizard.com/photo/industrial-financial-analysis-with-performance-graph/a73c2c4318ab0f5842ca4ec756acb918/>PikWizard</a>
</span>
</span>
<span class="image-link">
<span
style="margin: 0 0 20px 0; display: inline-block; vertical-align: middle; width: 100%;"
>
<a
target="_blank"
href="https://pikwizard.com/photo/industrial-financial-analysis-with-performance-graph/a73c2c4318ab0f5842ca4ec756acb918/"
style="text-decoration: none; font-size: 10px; margin: 0;"
>
<img src="https://pikwizard.com/pw/medium/a73c2c4318ab0f5842ca4ec756acb918.jpg" style="margin: 0; width: 100%;" alt="" />
<p style="font-size: 12px; margin: 0;">PikWizard</p>
</a>
</span>
</span>
Free (free of charge)
Free for personal and commercial use.
Author: People Creations
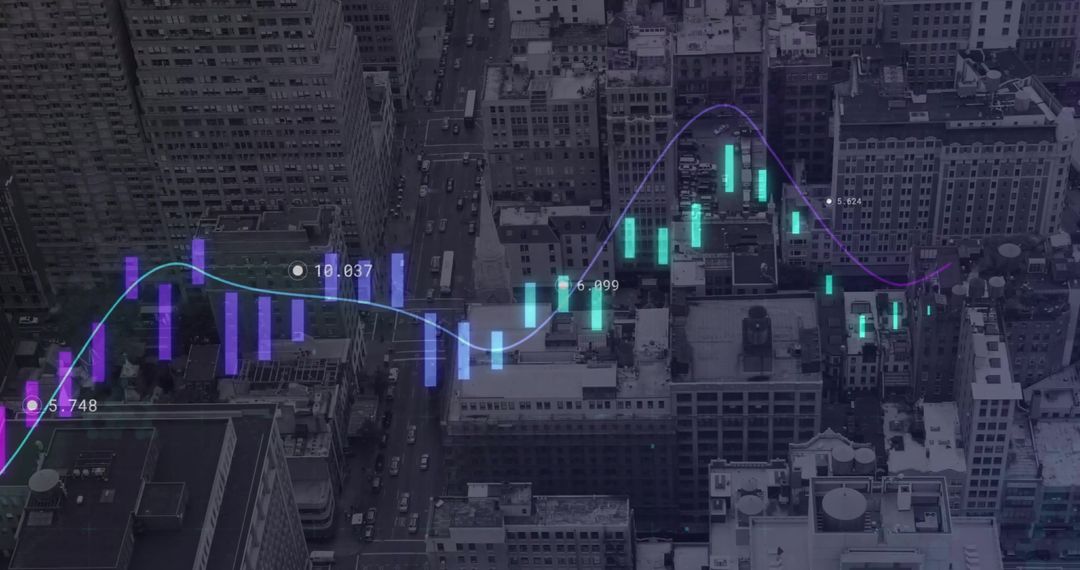
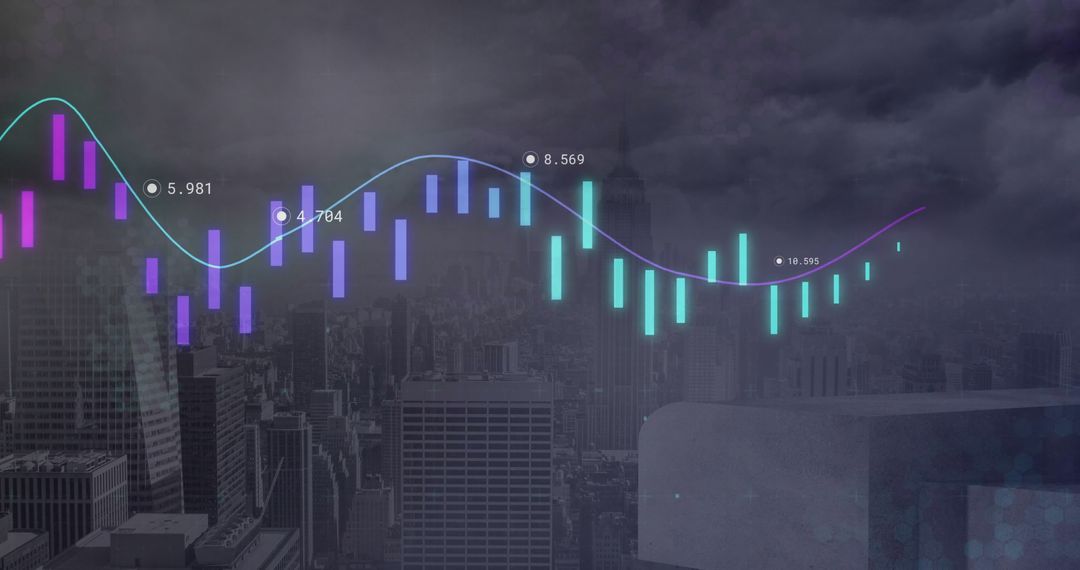
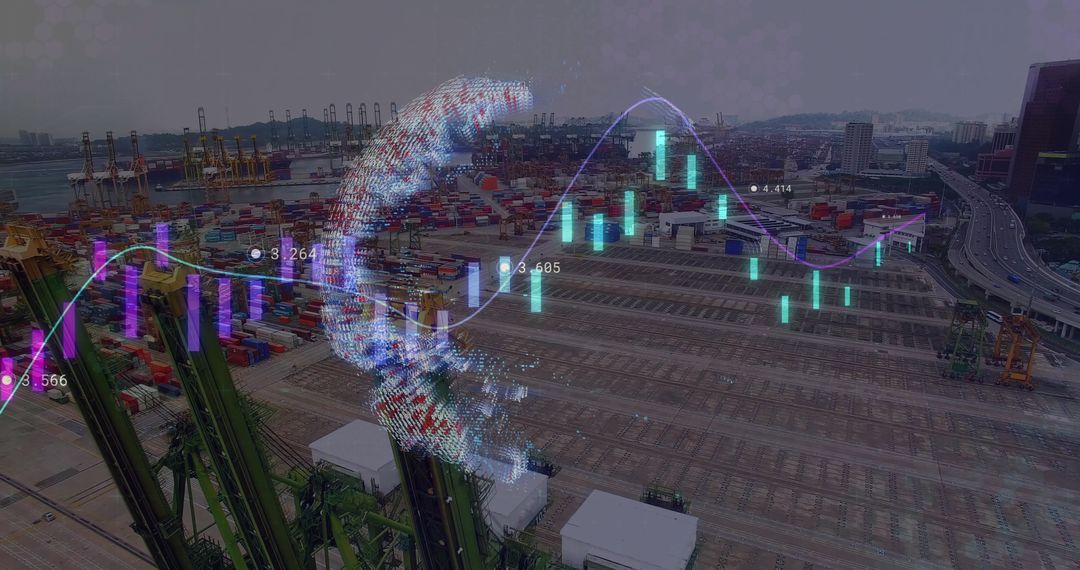
Similar Free Stock Images

Premium


Premium


Premium


Premium


Premium


Premium

Premium


Premium


Premium


Premium


Premium


Premium


Premium


Premium


Premium
Premium

Premium


Premium


Premium


Premium


Premium


Premium


Premium

Premium