1. Home > 
  2. Stock Photos > 
  3. Interactive Data Chart with Bar Graph and Line Analysis

Interactive Data Chart with Bar Graph and Line Analysis Image

Interactive Data Chart with Bar Graph and Line Analysis

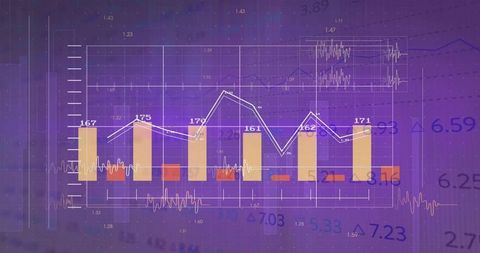
Illustrates a bar chart combined with a line graph, showcasing data trends over time in a high-tech, informative manner. Useful for presentations on business performance, editable dashboards for digital platforms, and detailed analytics reports. Analyzing varying metrics, highlighting different performance indicators, helping businesses track targets and outcomes effectively.

Powered by Adobe logo
Minimal finance data visualization set with colorful charts and graphs on white surface - Powered by AdobeFuturistic financial data visualization with glowing blue line graphs and vertical bar chart, Abstract financial chart with rising graphs - Powered by AdobeAbstract financial growth background with rising bar and line graphs, world map overlay, and upward arrows. Modern business data visualization in blue tones with golden highlights, symbolizing success - Powered by AdobeBusiness bar chart and line graph showing yearly business growth from 2022 to new year 2026, represent data analytics, future 2026 planning, business 2026 trend, and performance analysis 2026 Latch - Powered by AdobeUpward trending bar chart and line graph illustrating business progress and profits isolated on transparent background - Powered by Adobe

Credit Photo

If you would like to credit the Photo, here are some ways you can do so

Free (free of charge)

Free for personal and commercial use.

Author: Creative Art

Similar Free Stock Images

Digital Financial Analytics Dashboard Displaying Diverse Data Visualizations
Premium
Financial data visualization with green line and bar charts on black background
Digital Security in Global Finance Data Analysis
Digital Financial Graphs and Data Analysis Visualization
Premium
Abstract black and white financial graph with upward trend
Dynamic Financial Data with Global Connections and Insights
Digital Trading Desk with Line Graphs Representing Market Trends
Financial Analytics Dashboard with Trend Lines and Data Visualization
Dynamic Financial Dashboard Displaying Bar and Line Charts
Bar Chart with Line Graph on Automotive Technology Background
Digital Financial Graph Illustrating Stock Market Trends
Dynamic Financial Graph Displaying Market Trends
Digital Stock Market Analysis With City Background
Dynamic Stock Market Analysis on Digital Screen
Digital Analytics Chart Over Urban Cityscape
Dynamic Financial Graph with Data Analysis Conceptual Background
Soundwaves with Graph Overlays in Data Processing Concept
Stock Market Data Analysis with Futuristic Digital Interface
Digital Interface with Financial Data Analytics and Graphs
Digital Data Visualization with Futuristic Infographics
Digital Financial Analytics with Rising Graphs and Data Overlays
Premium
Digital abstract glowing blue bar graph and line chart showing financial growth and data analytics on a dark background
Transforming Data and Financial Analysis on Pink Graph
Data Visualization Merging Cyber Security Code Elements with Analytics Graphs
Innovative Data Visualization on Urban Skyline Background
Abstract Financial Data Concept on Pink Background
Premium
A colorful bar graph with a line graph showing an upward trend
Premium
Business growth and financial success concept with increasing bar graph and upward trend line in blue tones
Premium
Illustrative 3d rendering of a red bar graph showing steady upward progress indicated by a rising black line with an arrow symbolizing financial success and positive economic trends.
Financial Data Charts on Digital Interface Background
Colorful Stock Market Display with Graphs and Tickers on Blue Background
Digital Graph and Data Analysis with Financial Growth Trends
Futuristic Data Visualization with Dynamic Graphs
Dynamic Digital Data Dashboard with Analytics Charts and Graphs
Abstract Digital Stock Market Interface with Graphs and Data
Dynamic Financial Charts with Blue Digital Interface
Financial Data Dashboard with Multi-Color Bar and Line Graphs
Premium
Abstract blue 3D bar chart with glowing line graph shows market growth. Digital data visualization indicates positive trend. Financial analysis graphic with bokeh.
Stock Market Data Visualization With Bar and Line Graphs
Modern Data Dashboard Display with Interactive Charts
Financial Data Against Bolivia Flag with Colorful Bar and Line Graphs
Financial Data Analysis Graph with Growing Trends
Digital Financial Market Chart Visualization on Trading Screen
Premium
A 3d bar graph with a white arrow showing growth on a blue background with a glowing effect
Premium
Stock market investment trading graph growth. Trade business analytics graph and financial chart. Business trade analytics line graphs and financial chart investment. Chart
Dynamic Financial Data Visualization with Binary Code Overlay
Statistical Data and Trends Over Digital Grid Overlay
Cybersecurity Dashboard Displaying Code and Analytics Chart
Dynamic Financial Graphs on Digital Screen Displaying Market Trends
Ransomware Analytics Dashboard Showing Bar Line Charts on Purple Cybersecurity Grid
Dynamic Financial Graphs and Dashboard Analytics
Colorful Data Analytics Bar Graphs on Digital Screen
Interactive Financial Dashboard with Data Visualization and Analytics
Premium
Blue tone bar chart with rising trend and digital lines
Premium
Business bar chart and line graph showing yearly business growth from 2022 to new year 2026, represent data analytics, future 2026 planning, business 2026 trend, and performance analysis 2026 Vouch
NFT Trading Analytics Dashboard with Graphs and Data Metrics
Dynamic 3D Graph Analytics with Red and Blue Bars
Interactive Financial Graph on Digital Grid Background
Gym Weight Training Visualization with Performance Analytics Overlay
Futuristic Data Chart with Digital Interface Elements
Futuristic Digital Analytics Display with Bar and Line Charts
Digital Financial Data Analyzing with Bar and Line Graphs on Screen
Futuristic Green Pound Symbol Amid Financial Data Charts
Neon finance analytics dashboard streaming binary code with volatile line charts
Premium
Collection of various colorful business charts and graphs, including bar charts, line graphs, and pie charts, illustrating data analysis and financial reporting
Premium
Colorful bar chart and line graph financial data visualization
Financial Data Visualization with Charts and Graphs on Dashboard
Digital trading screen with rising charts and data analytics
Colombian Stock Market Data Amid Colored Background
Premium
A 3D graph illustrates financial growth over a dark city skyline, with ascending bars and a glowing line
Premium
Futuristic blue digital financial data visualization showing volatile stock market fluctuations.
Premium
Colorful bar graph with rising lines, symbolizing growth and data
Abstract Digital Financial Data Graph Chart
Data Analytics with Dynamic Global Market Trends on Screen
Futuristic Financial Trading Dashboard with Data Analytics Visualization
Bar and Line Graph Data Visualization in Purple Gradient Background
Premium
Red bar chart and line graph descending—sharp angles, dark backdrop—symbolizing decline, urgency, and the stark rhythm of financial loss, performance drop, and metric erosion.
Digital Interface of Data Processing Over Cityscape
Dynamic Stock Market Dashboard with Graph and Charts
Financial Data Analysis with Graphs and Charts on Dark Background
Digital Financial Data Analysis on Abstract Blue Background
Premium
Hand drawing red arc line over rising bar graph showing fluctuating growth in business or financial performance
Innovative Data Visualization with Digital Interface
Digital Financial Analysis with Graphs and Data Patterns
Abstract Financial Data Visualization with Global Connections
Colorful Financial Data Analytics and Digital Graph
Premium
A digital visualization of an upward trend bar chart and line graph for business analysis isolated on transparent background
Abstract Financial Data and Numbers in Virtual Environment
Futuristic Data Analytics Interface with Programming Code
Digital Stock Market Analysis with Falling Trend Arrow
Abstract Digital Dashboard Showing Data Analytics with Graphs and Code
Premium
A blue 3d bar chart with a white upward trend line on a light grey background showing growth and statistics
Candlestick Chart Illustrating Financial Trends and Analytics
Complex Financial Data Analysis on Purple Grid Background
Digital Financial Graphs and Business Analytics on Blue Backdrop
Digital Financial Data Representation with Bar and Line Graphs
Futuristic Stock Market Graphs on Digital Display
Digital Analytics Visualization with Bar and Line Graphs
Financial Data Overlay on Environmental Pollution Concept
Data Analytics with Digital Graphs and Charts on Dark Background
Financial Stock Market Trends Over Digital Grid Background
Abstract Graphic Business Data Visualization
Futuristic Financial Data Analytics on Digital Interface
Digital Financial Data and Statistics Analyzing Concept
Premium
Growth Charts Icons: Upward Trend, Success, Progress, Finance, Data Analysis
Digital Financial Data Analytics Wand Big Affect SEO Tools Commercial
Dynamic Data Dashboard with Bars and Network Nodes
Digital Financial Dashboard with Cyan Bar and Red Line Graph
Financial Data Display in Digital Grid Design
Premium
Glass globe near blue bar chart with upward trending line graph. Light flares on background plants. Worldwide economic growth data visualization.
Premium
Abstract visualization of financial growth and business success, featuring an upward-trending line graph and glowing bar charts on a digital grid background
Premium
Rising bar graph with line graph overlay on blue background
Financial Data and Graphs on Digital Screen
Global Financial Data and Statistics with Blue World Map Overlay
Financial Data Processing on Digital Graph Displayed on Screen
Futuristic Digital Interface with City Overlay and Data Graphs
Colorful Data Analytics Display on Dark Background
Digital Data Analytics Interface with Bar and Line Charts
Abstract Financial Chart with Growing Cryptocurrency Trends
Innovative Data Analysis on Automated Factory Floor
Colombian Flag Merging with Stock Market Graphs Illustrating Economy
Dynamic Financial Data Visualization with Charts and Arrows
Digital Bar Graph Display in Financial Data Analysis
Data Processing and Cloud Computing Server Room Visualization
Premium
A blue bar graph with a rising trend line on a black background
Explore More Free Stock Images