- Home >
- Stock Photos >
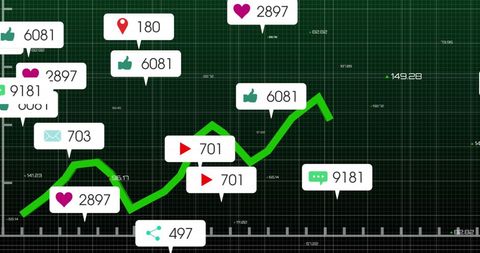
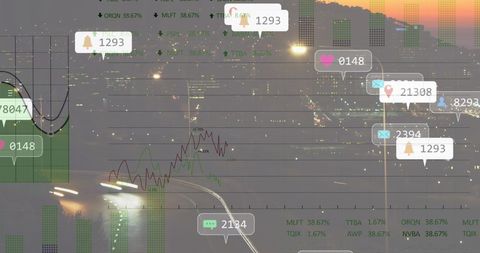
- Interactive Data Visualization with Metrics and Graphs
Interactive Data Visualization with Metrics and Graphs Image

Digital dashboard with interactive data visualizations depicting metrics with graphs on a blue grid background. Ideal for illustrating concepts of digital analytics, business data interpretation, user engagement feedback, and trends depiction in presentations, reports, or infographics.

downloads
Tags:
More
Credit Photo
If you would like to credit the Photo, here are some ways you can do so
Text Link
photo Link
<span class="text-link">
<span>
<a target="_blank" href=https://pikwizard.com/photo/interactive-data-visualization-with-metrics-and-graphs/32939d1aa23ff765b780b0b866e25371/>PikWizard</a>
</span>
</span>
<span class="image-link">
<span
style="margin: 0 0 20px 0; display: inline-block; vertical-align: middle; width: 100%;"
>
<a
target="_blank"
href="https://pikwizard.com/photo/interactive-data-visualization-with-metrics-and-graphs/32939d1aa23ff765b780b0b866e25371/"
style="text-decoration: none; font-size: 10px; margin: 0;"
>
<img src="https://pikwizard.com/pw/medium/32939d1aa23ff765b780b0b866e25371.jpg" style="margin: 0; width: 100%;" alt="" />
<p style="font-size: 12px; margin: 0;">PikWizard</p>
</a>
</span>
</span>
Free (free of charge)
Free for personal and commercial use.
Author: Authentic Images