1. Home > 
  2. Stock Photos > 
  3. Interactive Financial Dashboard with Data Visualization and Analytics

Interactive Financial Dashboard with Data Visualization and Analytics Image

Interactive Financial Dashboard with Data Visualization and Analytics

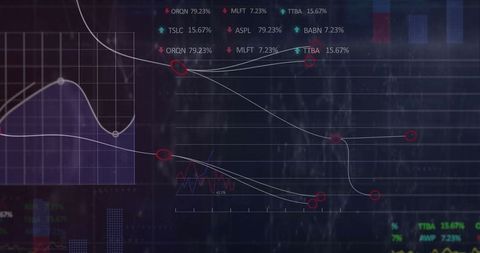
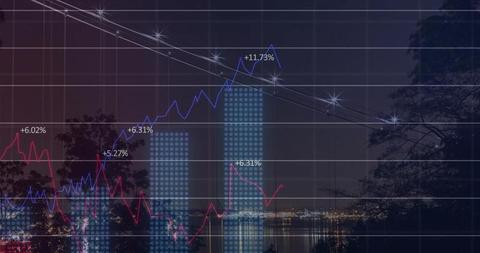
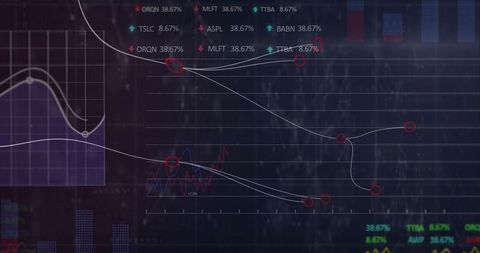
Dynamic data visualization capturing market trends with line and bar charts alongside binary digits, represents technical analysis and real-time analytics. Useful for finance-related platforms, digital analytics teaching, presentations on investment strategies.

Powered by Adobe logo
Abstract black and white financial graph with upward trend - Powered by AdobeA business team collaborates on data analysis, surrounded by charts and reports. They utilize digital tools to facilitate a productive meeting in a modern office environment. Gantry - Powered by AdobeFuturistic financial analytics visualization with blue holographic charts business growth - Powered by AdobeAbstract visualization of financial growth and business success, featuring an upward-trending line graph and glowing bar charts on a digital grid background - Powered by AdobeBusiness analyst pointing at dashboard with growth charts and data visualization in modern flat illustration style - Powered by Adobe

Credit Photo

If you would like to credit the Photo, here are some ways you can do so

Free (free of charge)

Free for personal and commercial use.

Author: Authentic Images

Similar Free Stock Images

Digital Financial Analytics Dashboard Displaying Diverse Data Visualizations
Premium
A professional in a suit interacts with a digital interface displaying data analytics charts emphasizing modern business technology and data driven decisions
Abstract Financial Data with Green Digital Background
Premium
Business analytics and data visualization on a futuristic digital interface with charts and graphs
Premium
Abstract 3D data visualization with glowing interface elements and charts
Financial Data Visualization with Charts and Graphs on Dashboard
Digital trading screen with rising charts and data analytics
Digital Trading Desk with Line Graphs Representing Market Trends
Digital Dashboard with Social Media Metrics and Dynamic Graphs
Premium
A finger touches a screen displaying business data and financial charts
Abstract Financial Data Analysis with Digital Figures
Futuristic Digital Financial Network and Economic Growth
Dynamic Financial Graph with Data Analysis Conceptual Background
Digital Data Streams Overlay Global Cityscape
Dynamic Stock Market Dashboard with Graph and Charts
Dynamic Financial Data Trends with Fluctuating Graphs and Charts
Dynamic Financial Data Analytics with Stock Market Trends
Premium
Digital business analytics dashboard with glowing holographic charts, graphs and data visualization icons floating above modern office desk for corporate strategy.
Premium
Visualizing startup growth financial charts data analysis and upward trends illustrated
Dynamic Data Visualization with Financial Charts and 3D Elements
Digital Financial Analytics with Rising Graphs and Data Overlays
Data Projection Over Cityscape Indicating Digital Economy
Abstract Financial Data Visualization with Global Connections
Premium
A clean and modern minimalist illustration depicting various business data visualization elements, including bar charts, a line graph, and a pie chart on a white background.
Digital Financial Data Graph with Winter Snowflake Theme
Abstract Landscape with Financial Data and Global Connections
Futuristic Data Analytics Interface with Programming Code
Digital Data with Financial Graphs on Global Grid
Premium
AI data analytics dashboard, business data insights, AI-powered data analysis dashboard, business strategy, Analyst or Scientist uses a computer and dashboard for analysis of information development
Premium
business man in suit analyzing charts and graphs on laptop screen in office setting. image show data visualization such as pie chart and bar graph, representing business analytics and decision-making.
Futuristic Green Pound Symbol Amid Financial Data Charts
Neon finance analytics dashboard streaming binary code with volatile line charts
Dynamic Financial Data Displayed Over Cityscape Background
Digital Security in Global Finance Data Analysis
Diverse Graphs and Data Over Urban Landscape
Selective Data Points on Dark Analytics Dashboard with Sleek Design
Premium
Man working at desk with data charts
Digital Financial Data Overlay on Urban Street Scene
Futuristic Holographic Interface with Data Analytics and Binary Code
Dynamic Financial Data with Overlaid Cityscape Interface
Dynamic Financial Graph Displaying Market Trends
Dynamic Data Dashboard with Bars and Network Nodes
Digital Data Visualization Overlaying Sports Stadium
Digital Interface of Data Processing Over Cityscape
Financial Data Chart with Rising Trends Overlaid on Cityscape Background
Dynamic Financial Graphs on Digital Screen Displaying Market Trends
Premium
Global financial trading chart with glowing blue bars and world map on digital interface background illustrating business data and economy concept. Ai generative
Futuristic Neon Network Graph with Cybersecurity Elements
Business Data Analysis Against City Skyscrapers
Financial Data and Graphs on Digital Screen
Digital Visualization of Global Networking with Statistical Graphs
Premium
Visual representation of digital marketing metrics and ads on a futuristic interface, showcasing data analysis through charts and graphs in a modern business setting. Gantry
Futuristic holographic data wall displaying rising analytics charts with neon interface
Digital Soundwaves and Traffic in Silhouette Cityscape
Financial Data Analytics with City Skyline Overlay
Abstract Financial Data and Numbers in Virtual Environment
Premium
AI finance business data analysis digital technology investment trading market stock, financial analyst using advanced holographic interface for global market insight, smart investment strategy
Futuristic Global Business and Data Interface Concept
Futuristic Financial Data Visualization with Neon Overlay
Data Processing and Cloud Computing Server Room Visualization
Futuristic Streaming Analytics Dashboard with Data Visualization
Premium
Upward trending financial charts and graphs data analytics
Futuristic Data Visualization with Dynamic Graphs
Data Visualization on Analytics Dashboard with Line Graphs and Icons
Premium
Digital data visualization with glowing financial graphs and charts emerging from a blurred modern keyboard symbolizing technology and market analysis concepts
Financial Data and Cityscape at Night with Rising Graph
Digital Financial Data Visualization with Graphs and Charts
Futuristic Financial Analysis Over Urban Skyline at Night
Financial Data Overlay on Environmental Pollution Concept
Premium
Glowing arrow graph rising over planet earth with financial charts in dark blue and orange colors, showing business growth and success concept
Premium
Businessman interacting with digital forex and stock market chart interface showing buy and sell decisions with futuristic holographic data overlay.
Digital DNA and Brain Data Interface Display in Dark Theme
Futuristic Financial Trading Dashboard with Data Analytics Visualization
Advanced Financial Data Dashboard with Dynamic Graphs and Metrics
Premium
Business professional holding rising bar charts with upward arrows, representing data analytics, business growth, performance metrics, financial success, and strategic planning in digital economy.
Premium
Visualize dynamic data streams and growth charts on futuristic holographic displays showing business analytics and financial trends for modern strategy.
Premium
Vibrant data visualization with dynamic graphs and charts on grid background
Digital Fingerprint with Data Overlay on Futuristic Interface
Digital Financial Data Analysis on Abstract Blue Background
Financial Data Visualization in Server Room Setting
Dynamic Financial Graphs and Dashboard Analytics
Premium
Futuristic visualization of dynamic growth charts showcasing data trends and insights
Abstract Financial Chart Showing Upward Trend in Global Market
Transforming Data and Financial Analysis on Pink Graph
Digital Fingerprint Overlayed on Financial Data Illustrating Cybersecurity
Futuristic Financial Data Analysis with Graphs and Charts
Premium
Abstract colorful data visualization with charts, graphs, and pie charts, isolated on white background
Dynamic Financial Data Graph Illustrating Stock Market Trends
Futuristic Data Chart with Digital Interface Elements
Global Financial Data and Analytics Overlay
Financial Visualization Overlooking Urban Cityscape
Digital Financial Data Analyzing with Bar and Line Graphs on Screen
Digital Financial Data Stream with Numeric Overlay
Dynamic Digital Interface Displaying Financial Data Analysis
Digital Financial Graphs and Business Analytics on Blue Backdrop
Digital Graphs Over Cityscape Representing Global Business Growth
Dynamic Graphs and Charts on Technology Background
Futuristic Stock Market Graphs on Digital Display
Dynamic Data Analytics Interface Showing Statistical Trends
Financial Data Dashboard with Multi-Color Bar and Line Graphs
Digital Financial Data Analysis with Share Icons
Financial Data Graph Overlapping Construction Infrastructure
Data Processing and Statistics Visualization in Server Room
Abstract Overlay of Statistical Data on Urban Buildings
Premium
 Minimal 3D render of sheets and charts in green and white
Futuristic Data Recovery Concept on Digital Interface
Futuristic Digital Finance Interface with Technology Elements
Stock Market Data Analysis with Futuristic Digital Interface
Futuristic Data Analysis Grid with Trend Lines and Markers
Digital Financial Dashboard with Trending Market Data Analytics
Digital Data Visualization with Futuristic Infographics
Innovative Financial Dashboard with Acuity Analysis
Dynamic Financial Data and Graphs on Digital Interface
Digital Data Stream and Interface in Futuristic Environment
Financial Analytics Dashboard with Growth Trends and Indicators
Premium
Modern financial growth background with stock charts and investment analytics
Financial Data Visualization and Digital Analysis Concept
NFT Trading Analytics Dashboard with Graphs and Data Metrics
Global Financial Analytics on Digital World Map
Financial Data Overlay on Urban Skyscrapers
Premium
Isometric blue data visualization with stacked charts and models in a modern office theme
Stock Market Analysis Digital Screen with Graphs and Trends
Global Stock Trading Concepts with Dynamic Data Visualizations
Colorful Stock Market Display with Graphs and Tickers on Blue Background
Financial Graphs with Cityscape Background Reflecting Market Trends
Explore More Free Stock Images