
- Home >
- Stock Photos >
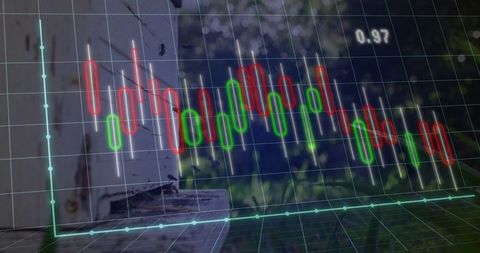
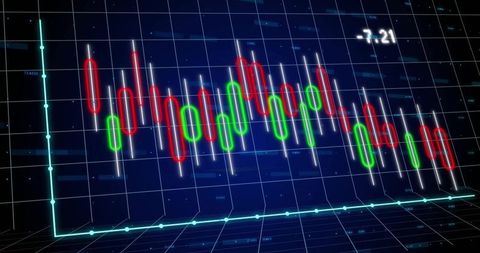
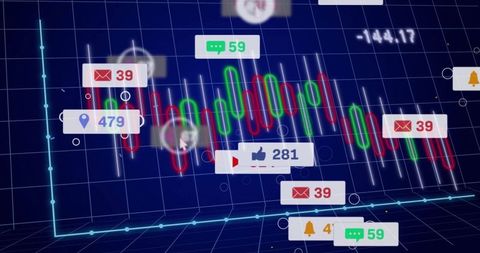
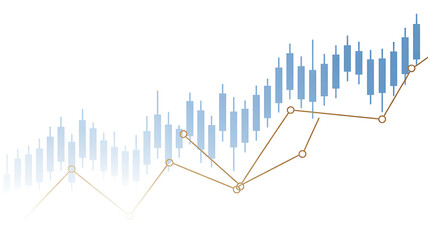
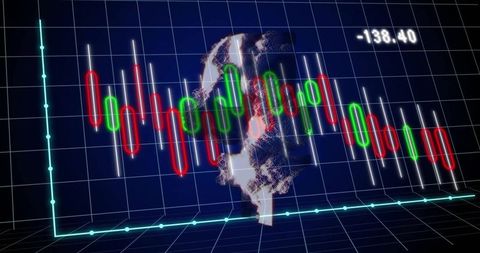
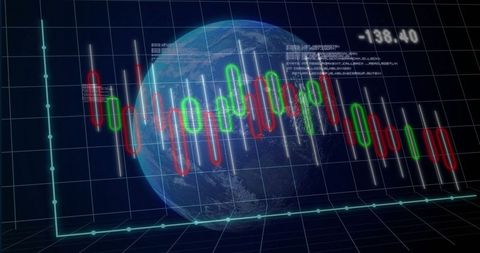
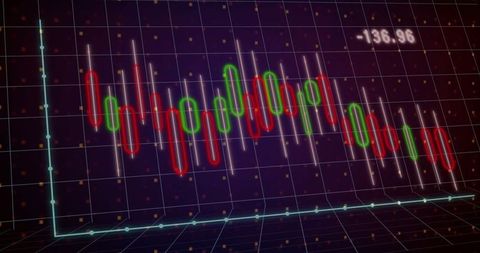
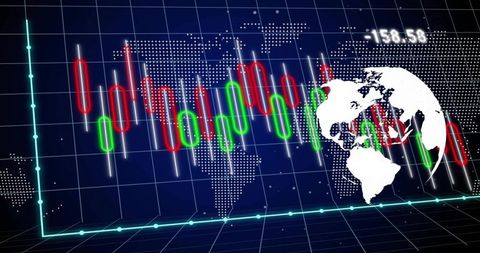
- Interactive Financial Trading Screen with Candlestick Chart
Interactive Financial Trading Screen with Candlestick Chart Image
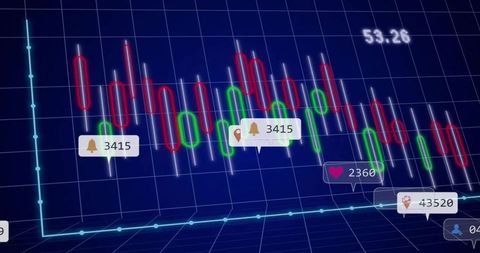
This illustration depicts an interactive financial trading screen displaying a detailed candlestick chart. Various colored bars and a blue line emphasize real-time data visualization and market trends. On-screen notifications indicate social engagement and make tracking simpler for investors. This graphic is ideal for use in articles, presentations, or by online trading platforms that aim to educate or inform about financial analytics and market conditions.
Powered by 


downloads
Tags:
More
Credit Photo
If you would like to credit the Photo, here are some ways you can do so
Text Link
photo Link
<span class="text-link">
<span>
<a target="_blank" href=https://pikwizard.com/photo/interactive-financial-trading-screen-with-candlestick-chart/99bc9ace9ef46f58682ff22ebd161c65/>PikWizard</a>
</span>
</span>
<span class="image-link">
<span
style="margin: 0 0 20px 0; display: inline-block; vertical-align: middle; width: 100%;"
>
<a
target="_blank"
href="https://pikwizard.com/photo/interactive-financial-trading-screen-with-candlestick-chart/99bc9ace9ef46f58682ff22ebd161c65/"
style="text-decoration: none; font-size: 10px; margin: 0;"
>
<img src="https://pikwizard.com/pw/medium/99bc9ace9ef46f58682ff22ebd161c65.jpg" style="margin: 0; width: 100%;" alt="" />
<p style="font-size: 12px; margin: 0;">PikWizard</p>
</a>
</span>
</span>
Free (free of charge)
Free for personal and commercial use.
Author: Awesome Content
Similar Free Stock Images

Premium

Premium

Premium


Premium


Premium


Premium


Premium


Premium


Premium


Premium


Premium


Premium


Premium


Premium

Premium

Premium


Premium
Premium


Premium

Premium


Premium


Premium


Premium


Premium


Premium


Explore More Free Stock Images