- Home >
- Stock Photos >
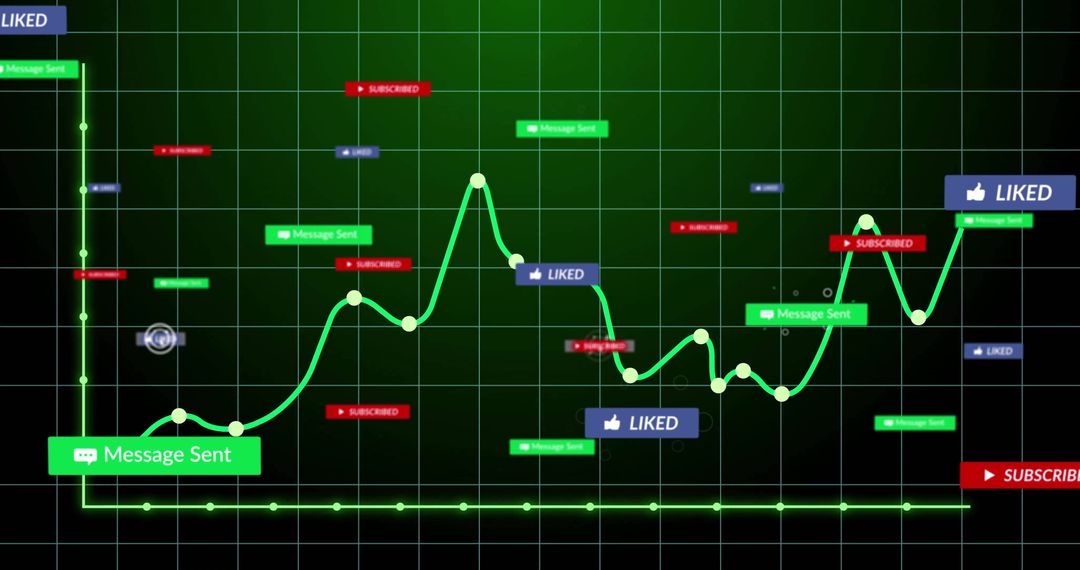
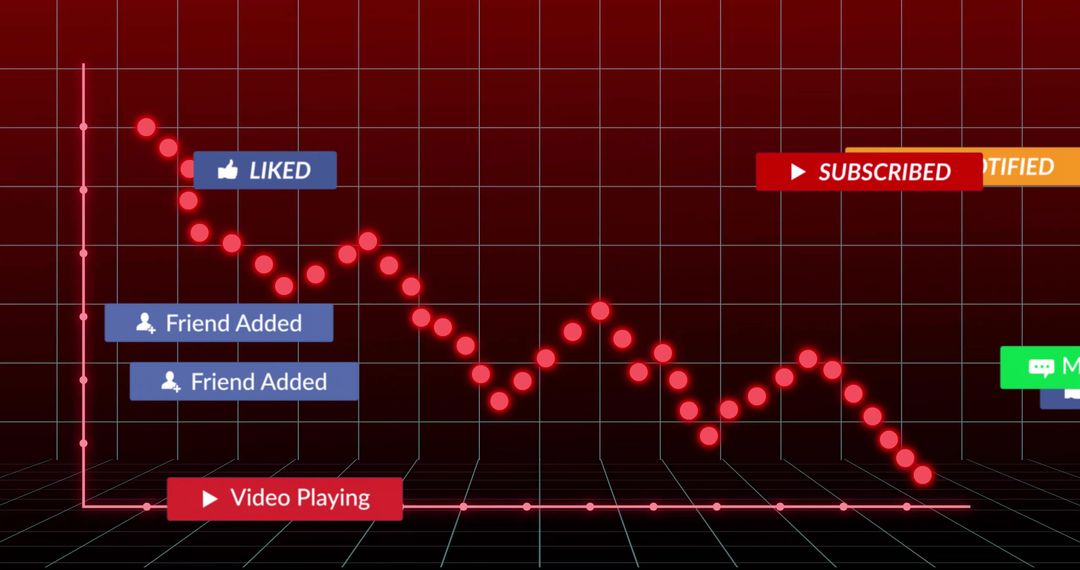
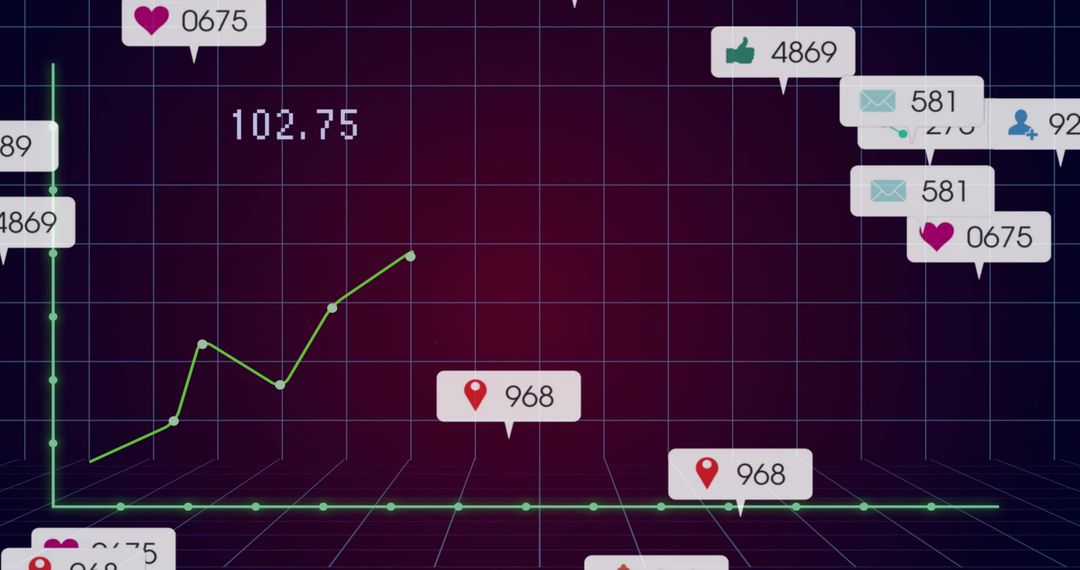
- Interactive Neon Line Chart Tracking Data Trends with Callouts and Circular Markers
Interactive Neon Line Chart Tracking Data Trends with Callouts and Circular Markers Image
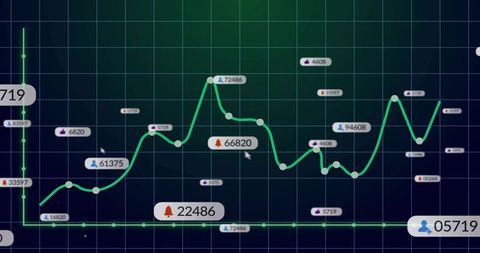
Featuring neon green trend line moving across teal grid with glowing circular markers, numeric callouts, and hovering cursor. Conveying real-time analytics, performance monitoring, social metrics, and financial data trends. Serving dashboard layouts, presentation slides, website hero banners, blog headers, marketing materials, white papers, pitch decks, and social posts. Including high-contrast neon palette and clear axis lines for readability in dark UI themes. Allowing color swaps and overlaying of logos, headlines, or custom metrics to match brand identity. Providing modern tech and fintech visual language for data-driven storytelling, investor reporting, and executive summaries.
Powered by 


0
downloads
downloads
Tags:
More
Credit Photo
If you would like to credit the Photo, here are some ways you can do so
Text Link
photo Link
<span class="text-link">
<span>
<a target="_blank" href=https://pikwizard.com/photo/interactive-neon-line-chart-tracking-data-trends-with-callouts-and-circular-markers/75bfa989cba59e6332e018a2bf677343/>PikWizard</a>
</span>
</span>
<span class="image-link">
<span
style="margin: 0 0 20px 0; display: inline-block; vertical-align: middle; width: 100%;"
>
<a
target="_blank"
href="https://pikwizard.com/photo/interactive-neon-line-chart-tracking-data-trends-with-callouts-and-circular-markers/75bfa989cba59e6332e018a2bf677343/"
style="text-decoration: none; font-size: 10px; margin: 0;"
>
<img src="https://pikwizard.com/pw/medium/75bfa989cba59e6332e018a2bf677343.jpg" style="margin: 0; width: 100%;" alt="" />
<p style="font-size: 12px; margin: 0;">PikWizard</p>
</a>
</span>
</span>
Free (free of charge)
Free for personal and commercial use.
Author: Awesome Content
Similar Free Stock Images

Premium


Premium


Premium


Premium


Premium


Premium


Premium


Premium


Premium


Premium


Premium


Premium


Premium


Premium


Premium


Premium


Premium


Premium


Premium


Premium


Premium


Premium


Premium


Premium