
- Home >
- Stock Photos >
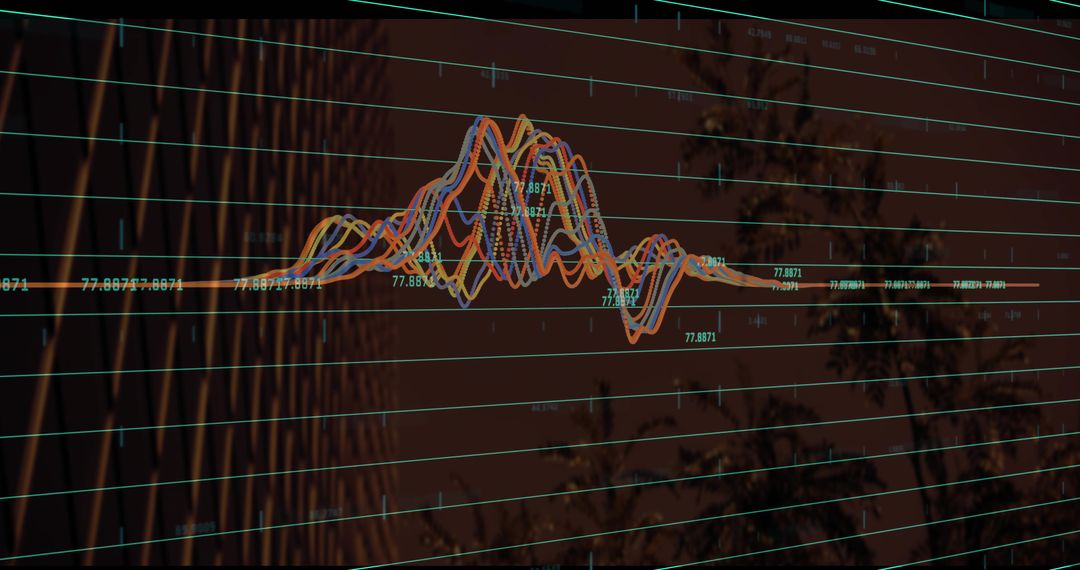
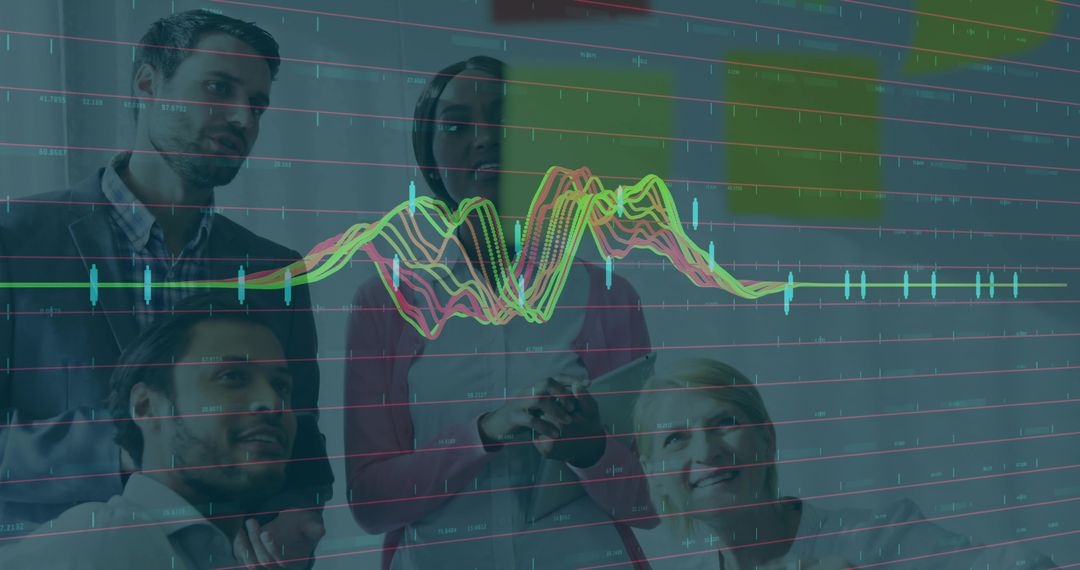
- Man reaching holographic data interface with multicolor waveform peaks and green grid HUD
Man reaching holographic data interface with multicolor waveform peaks and green grid HUD Image
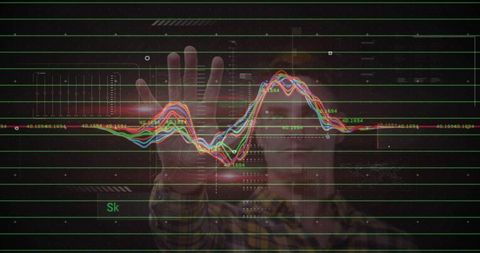
Depicting man reaching through translucent holographic waveform over green grid and digital HUD, creating futuristic data interaction aesthetic. Featuring vibrant multicolor lines and peaks, drawing focus to central gesture while dark background enhancing contrast and depth. Serving technology blogs, analytics reports, corporate presentations, product pages, advertising, and social media campaigns. Working well as header visual for data science teams, cover art for AI and machine learning articles, or background for pitch decks about IoT and signal analysis. Allowing space for text overlay, logos, and branding, and supporting color grading or compositing for editorial and marketing use.
Powered by  - Get 15% off with code: PIKWIZARD15


0
downloads
downloads
Tags:
More
Credit Photo
If you would like to credit the Photo, here are some ways you can do so
Text Link
photo Link
<span class="text-link">
<span>
<a target="_blank" href=https://pikwizard.com/photo/man-reaching-holographic-data-interface-with-multicolor-waveform-peaks-and-green-grid-hud/3ec316d269d7d636edf2ad4ade186925/>PikWizard</a>
</span>
</span>
<span class="image-link">
<span
style="margin: 0 0 20px 0; display: inline-block; vertical-align: middle; width: 100%;"
>
<a
target="_blank"
href="https://pikwizard.com/photo/man-reaching-holographic-data-interface-with-multicolor-waveform-peaks-and-green-grid-hud/3ec316d269d7d636edf2ad4ade186925/"
style="text-decoration: none; font-size: 10px; margin: 0;"
>
<img src="https://pikwizard.com/pw/medium/3ec316d269d7d636edf2ad4ade186925.jpg" style="margin: 0; width: 100%;" alt="" />
<p style="font-size: 12px; margin: 0;">PikWizard</p>
</a>
</span>
</span>
Free (free of charge)
Free for personal and commercial use.
Author: Creative Art
Similar Free Stock Images
Premium


Premium


Premium


Premium


Premium


Premium


Premium


Premium


Premium


Premium


Premium


Premium


Premium


Premium


Premium


Premium


Premium


Premium


Premium


Premium


Premium


Premium


Premium

Premium

