
- Home >
- Stock Photos >
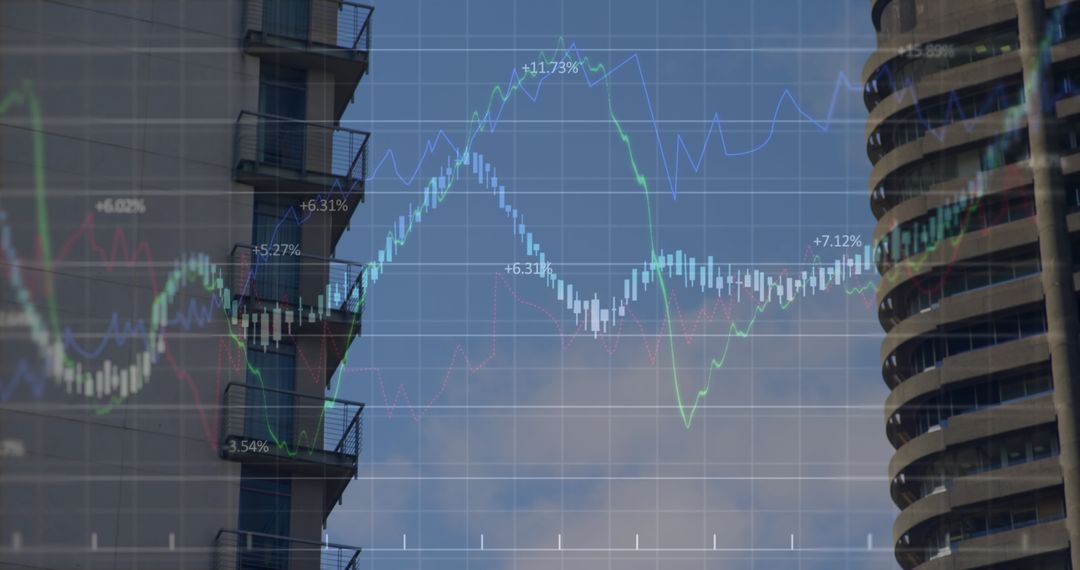
- Modern Business Growth Graphs Over Urban Architecture
Modern Business Growth Graphs Over Urban Architecture Image

Graphs displaying changing statistics overlaid on modern urban buildings suggest dynamic business growth. Ideal for financial reports, business presentations, or economic trend articles. Highlights the blend of technological analysis with traditional corporate structures.
Powered by  - Get 15% off with code: PIKWIZARD15


2
downloads
downloads
Tags:
More
Credit Photo
If you would like to credit the Photo, here are some ways you can do so
Text Link
photo Link
<span class="text-link">
<span>
<a target="_blank" href=https://pikwizard.com/photo/modern-business-growth-graphs-over-urban-architecture/3ba66665c110647bd77f4a25dac1a1a6/>PikWizard</a>
</span>
</span>
<span class="image-link">
<span
style="margin: 0 0 20px 0; display: inline-block; vertical-align: middle; width: 100%;"
>
<a
target="_blank"
href="https://pikwizard.com/photo/modern-business-growth-graphs-over-urban-architecture/3ba66665c110647bd77f4a25dac1a1a6/"
style="text-decoration: none; font-size: 10px; margin: 0;"
>
<img src="https://pikwizard.com/pw/medium/3ba66665c110647bd77f4a25dac1a1a6.jpg" style="margin: 0; width: 100%;" alt="" />
<p style="font-size: 12px; margin: 0;">PikWizard</p>
</a>
</span>
</span>
Free (free of charge)
Free for personal and commercial use.
Author: Authentic Images
Similar Free Stock Images

Premium


Premium


Premium


Premium


Premium


Premium


Premium


Premium


Premium


Premium


Premium


Premium


Premium


Premium


Premium


Premium


Premium


Premium


Premium


Premium


Premium


Premium


Premium


Premium

