- Home >
- Stock Photos >
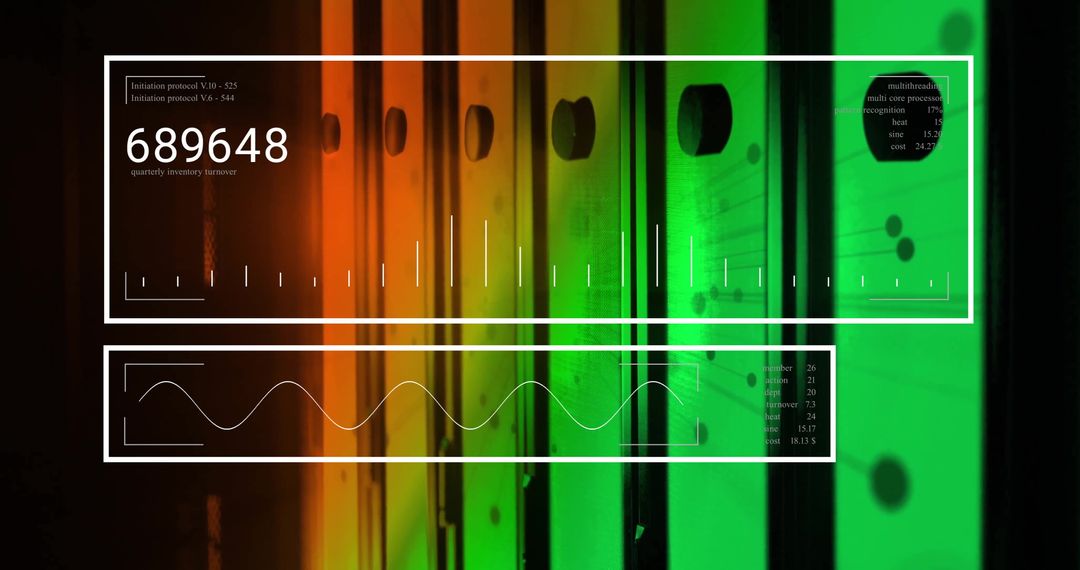
- Modern Multi-Colored Financial Graphs on Digital Dashboard
Modern Multi-Colored Financial Graphs on Digital Dashboard Image

Perfect for illustrating articles or presentations on financial analysis and data trends, this colorful digital dashboard coverage makes complex data easier to understand. Useful for web design templates, showcasing a dynamic and modern approach to business analytics and financial data representation.
Powered by  - Get 15% off with code: PIKWIZARD15


0
downloads
downloads
Tags:
More
Credit Photo
If you would like to credit the Photo, here are some ways you can do so
Text Link
photo Link
<span class="text-link">
<span>
<a target="_blank" href=https://pikwizard.com/photo/modern-multi-colored-financial-graphs-on-digital-dashboard/e211519d207edcde60a9ea844d38800a/>PikWizard</a>
</span>
</span>
<span class="image-link">
<span
style="margin: 0 0 20px 0; display: inline-block; vertical-align: middle; width: 100%;"
>
<a
target="_blank"
href="https://pikwizard.com/photo/modern-multi-colored-financial-graphs-on-digital-dashboard/e211519d207edcde60a9ea844d38800a/"
style="text-decoration: none; font-size: 10px; margin: 0;"
>
<img src="https://pikwizard.com/pw/medium/e211519d207edcde60a9ea844d38800a.jpg" style="margin: 0; width: 100%;" alt="" />
<p style="font-size: 12px; margin: 0;">PikWizard</p>
</a>
</span>
</span>
Free (free of charge)
Free for personal and commercial use.
Author: Creative Art
Similar Free Stock Images

Premium


Premium


Premium


Premium


Premium


Premium


Premium


Premium


Premium


Premium


Premium


Premium


Premium


Premium


Premium


Premium


Premium


Premium


Premium


Premium


Premium


Premium


Premium


Premium