
- Home >
- Stock Photos >
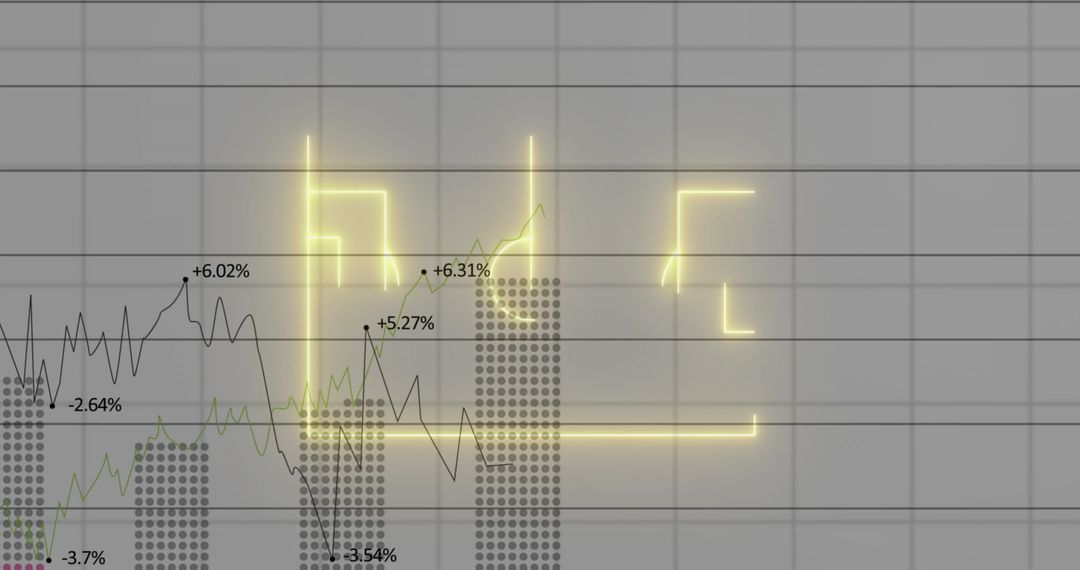
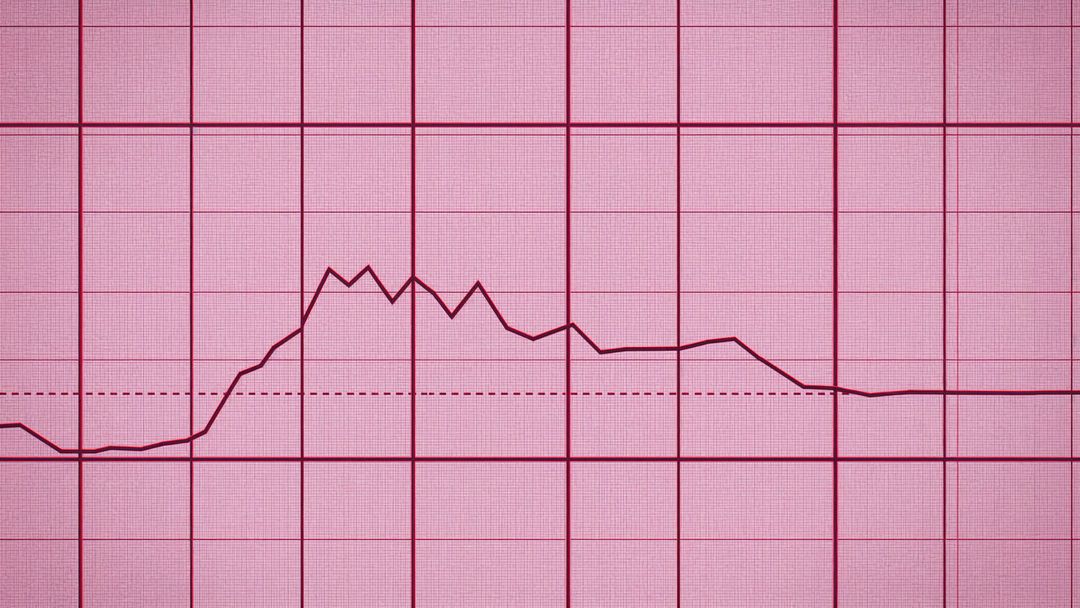
- Monochrome Financial Dashboard Showing Growth Trend with Green Line and Dot Bars
Monochrome Financial Dashboard Showing Growth Trend with Green Line and Dot Bars Image
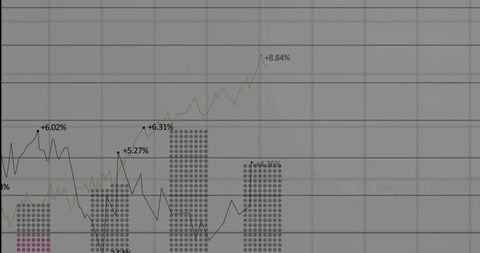
Showing green upward trend line with dark jagged comparative line, dot-style clustered bars and percent labels over grid. Highlighting growth, volatility and comparative performance for finance and analytics content. Working well for presentations, investor reports, web banners, blog headers, pitch decks and market analysis slides. Allowing overlaying of text, chart annotations and data callouts for report covers or social media posts. Fitting minimalist, corporate and technical design themes while providing clear focal point with green accent.
Powered by  - Get 15% off with code: PIKWIZARD15


0
downloads
downloads
Tags:
More
Credit Photo
If you would like to credit the Photo, here are some ways you can do so
Text Link
photo Link
<span class="text-link">
<span>
<a target="_blank" href=https://pikwizard.com/photo/monochrome-financial-dashboard-showing-growth-trend-with-green-line-and-dot-bars/cf9842fbe4f6d4e5660ebc6c7b2c44a1/>PikWizard</a>
</span>
</span>
<span class="image-link">
<span
style="margin: 0 0 20px 0; display: inline-block; vertical-align: middle; width: 100%;"
>
<a
target="_blank"
href="https://pikwizard.com/photo/monochrome-financial-dashboard-showing-growth-trend-with-green-line-and-dot-bars/cf9842fbe4f6d4e5660ebc6c7b2c44a1/"
style="text-decoration: none; font-size: 10px; margin: 0;"
>
<img src="https://pikwizard.com/pw/medium/cf9842fbe4f6d4e5660ebc6c7b2c44a1.jpg" style="margin: 0; width: 100%;" alt="" />
<p style="font-size: 12px; margin: 0;">PikWizard</p>
</a>
</span>
</span>
Free (free of charge)
Free for personal and commercial use.
Author: Creative Art
Similar Free Stock Images
Premium


Premium


Premium


Premium


Premium


Premium


Premium


Premium


Premium


Premium


Premium


Premium


Premium


Premium


Premium


Premium


Premium


Premium


Premium


Premium


Premium


Premium


Premium


Premium

