- Home >
- Stock Photos >
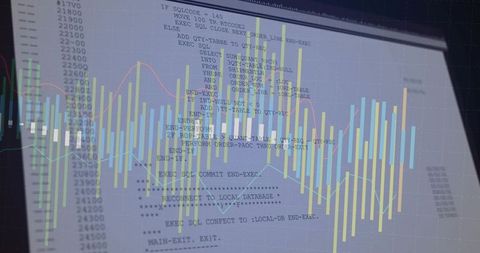
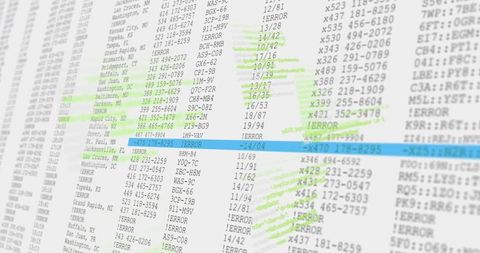
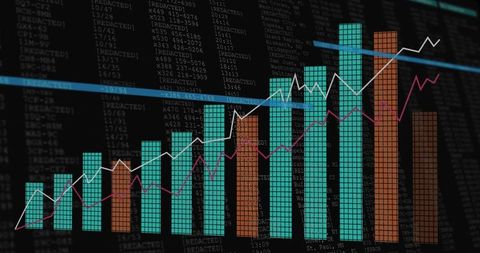
- Multilayer Trading Dashboard Overlaying Code Editor, Candlestick Charts and Visualizations
Multilayer Trading Dashboard Overlaying Code Editor, Candlestick Charts and Visualizations Image

Blending code editor snippets with candlestick charts, histogram bars and gridlines to create tech-driven trading visual. Emphasizing multilayer overlay and translucent panels for presenting algorithmic trading concepts and real-time market data. Conveying high-tech, analytical mood suitable for fintech, brokerage, trading desk, data science and investment content. Working well for website hero, app background, slide deck illustration, blog header, marketing campaign, product demo or training material. Providing generous negative space for headline, logo or call-to-action and allowing tight crops for close-up detail. Pairing with bold typography and high-contrast overlays to enhance legibility and brand messaging.

downloads
Credit Photo
If you would like to credit the Photo, here are some ways you can do so
Free (free of charge)
Free for personal and commercial use.
Author: Awesome Content