- Home >
- Stock Photos >
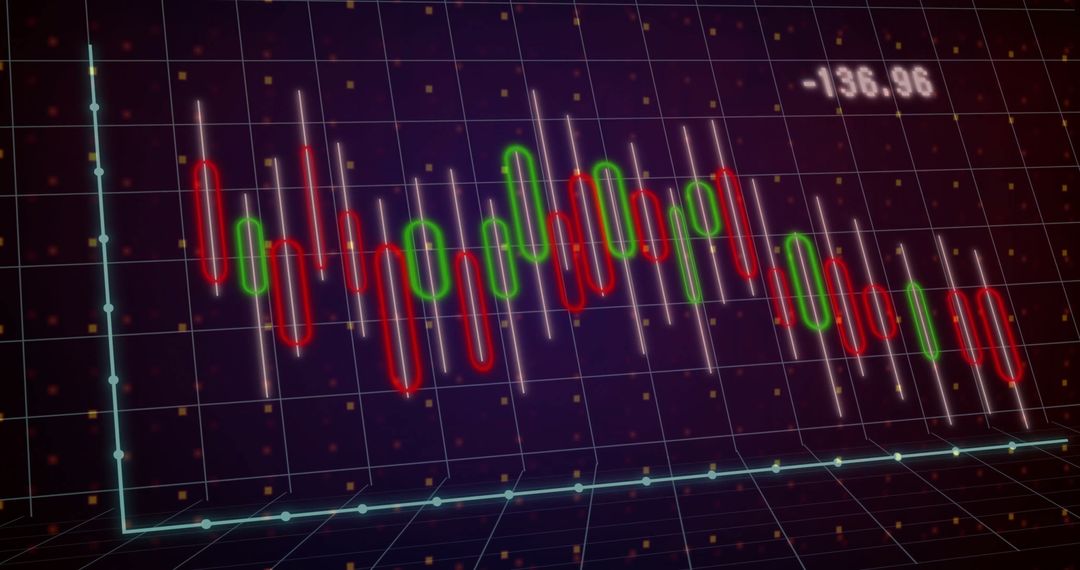
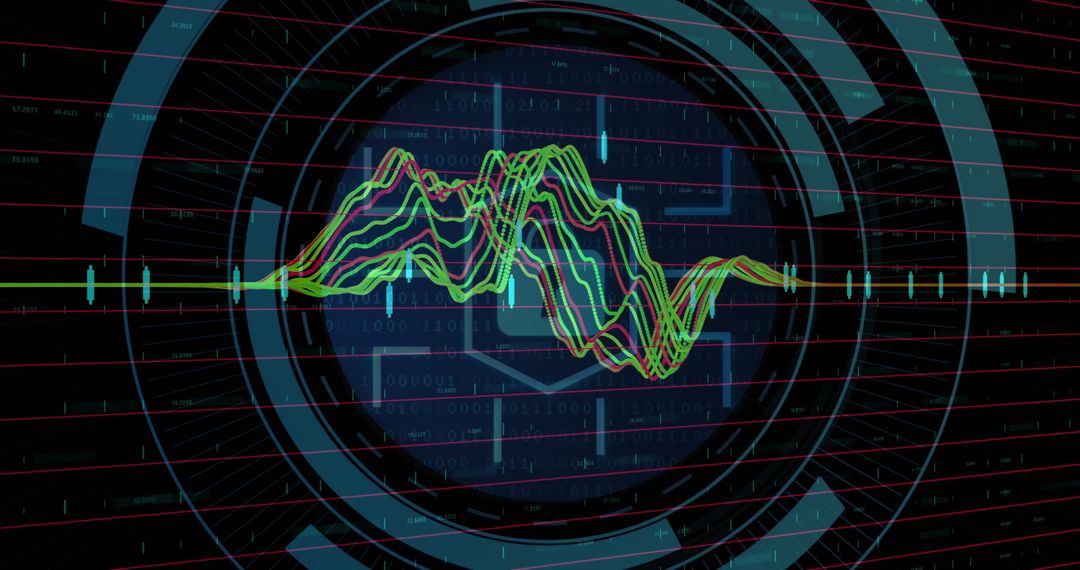
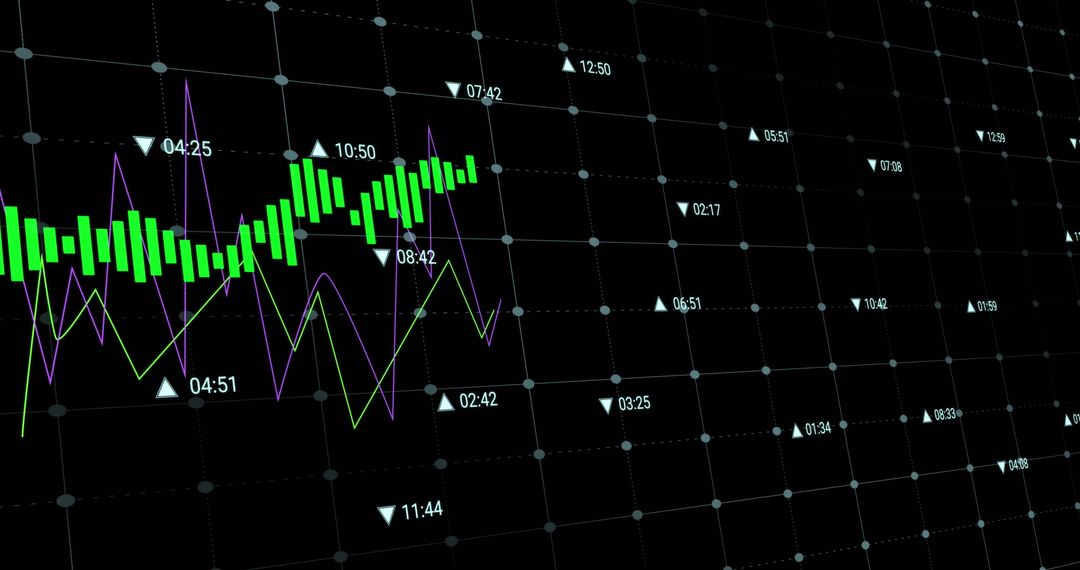
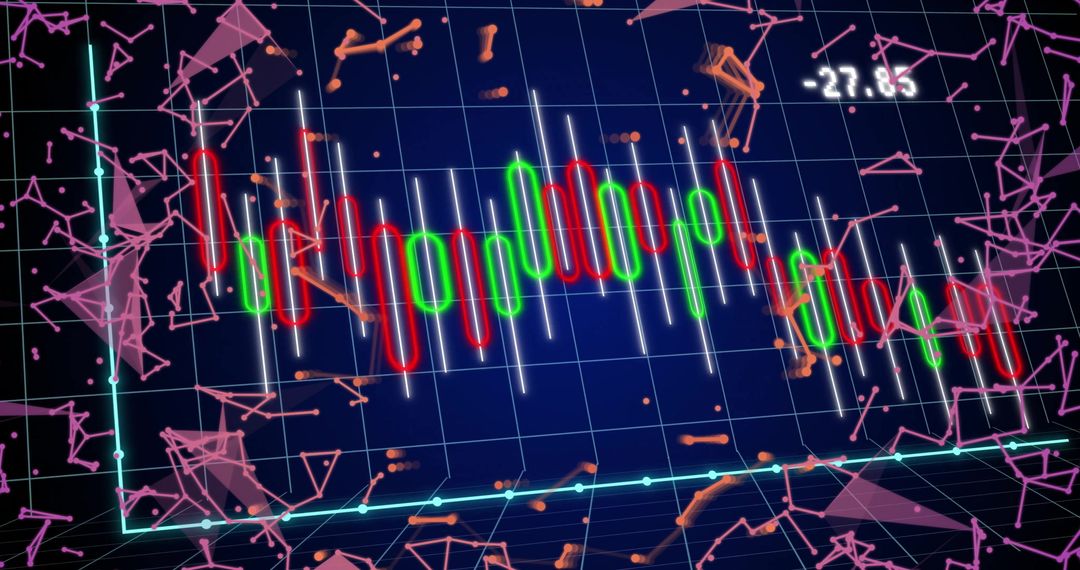
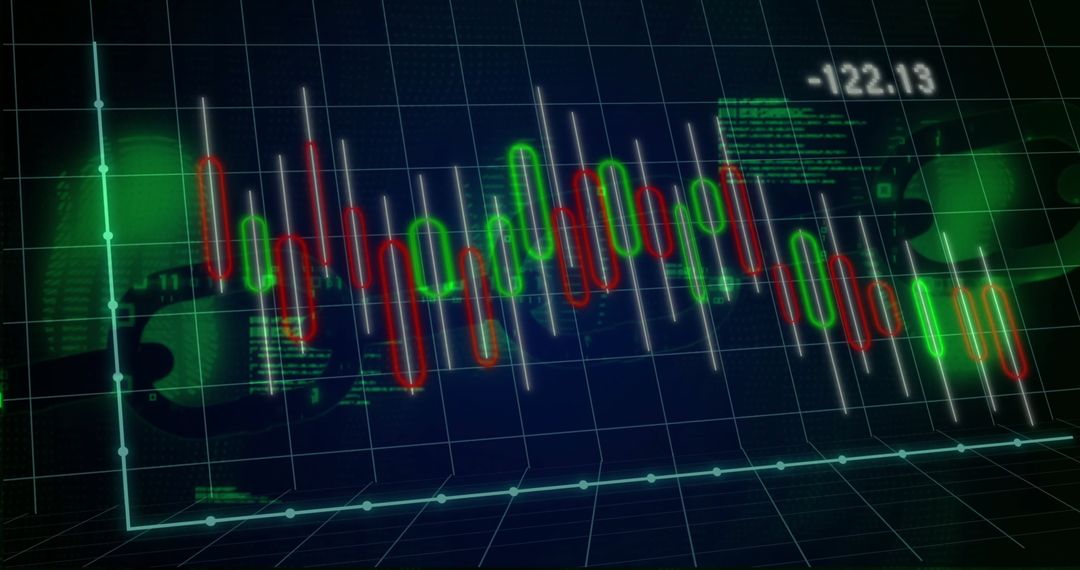
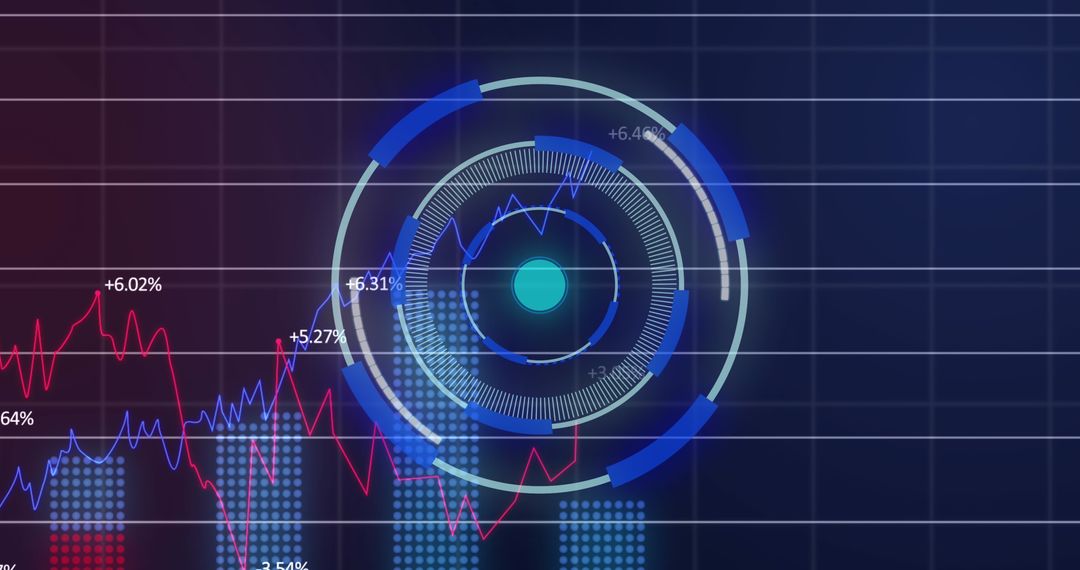
- Neon 3D Candlestick Chart Visualizing Cryptocurrency Trading on Futuristic HUD Interface
Neon 3D Candlestick Chart Visualizing Cryptocurrency Trading on Futuristic HUD Interface Image

Depicting neon candlestick bars with white wicks over gridded 3D plane and circular HUD elements, numeric readout 0.00. Featuring alternating red and green candles, glowing axes, and subtle grid perspective for high-tech market visualization. Ideal for illustrating fintech dashboards, trading platforms, cryptocurrency pages, market analysis articles, investment reports, and educational content about technical analysis. Working well as website hero, slide background, blog header, social media ad, app splash screen, or video thumbnail. Leaving ample space for overlaying text, logos, or chart annotations and supporting color grading for dramatic, futuristic branding.
Powered by  - Get 15% off with code: PIKWIZARD15


0
downloads
downloads
Tags:
More
Credit Photo
If you would like to credit the Photo, here are some ways you can do so
Text Link
photo Link
<span class="text-link">
<span>
<a target="_blank" href=https://pikwizard.com/photo/neon-3d-candlestick-chart-visualizing-cryptocurrency-trading-on-futuristic-hud-interface/41b5468c2da40ea22b07d2cc088f3e03/>PikWizard</a>
</span>
</span>
<span class="image-link">
<span
style="margin: 0 0 20px 0; display: inline-block; vertical-align: middle; width: 100%;"
>
<a
target="_blank"
href="https://pikwizard.com/photo/neon-3d-candlestick-chart-visualizing-cryptocurrency-trading-on-futuristic-hud-interface/41b5468c2da40ea22b07d2cc088f3e03/"
style="text-decoration: none; font-size: 10px; margin: 0;"
>
<img src="https://pikwizard.com/pw/medium/41b5468c2da40ea22b07d2cc088f3e03.jpg" style="margin: 0; width: 100%;" alt="" />
<p style="font-size: 12px; margin: 0;">PikWizard</p>
</a>
</span>
</span>
Free (free of charge)
Free for personal and commercial use.
Author: Awesome Content
Similar Free Stock Images

Premium


Premium


Premium


Premium


Premium


Premium


Premium


Premium


Premium


Premium


Premium


Premium


Premium


Premium


Premium


Premium


Premium


Premium


Premium


Premium


Premium


Premium


Premium


Premium