- Home >
- Stock Photos >
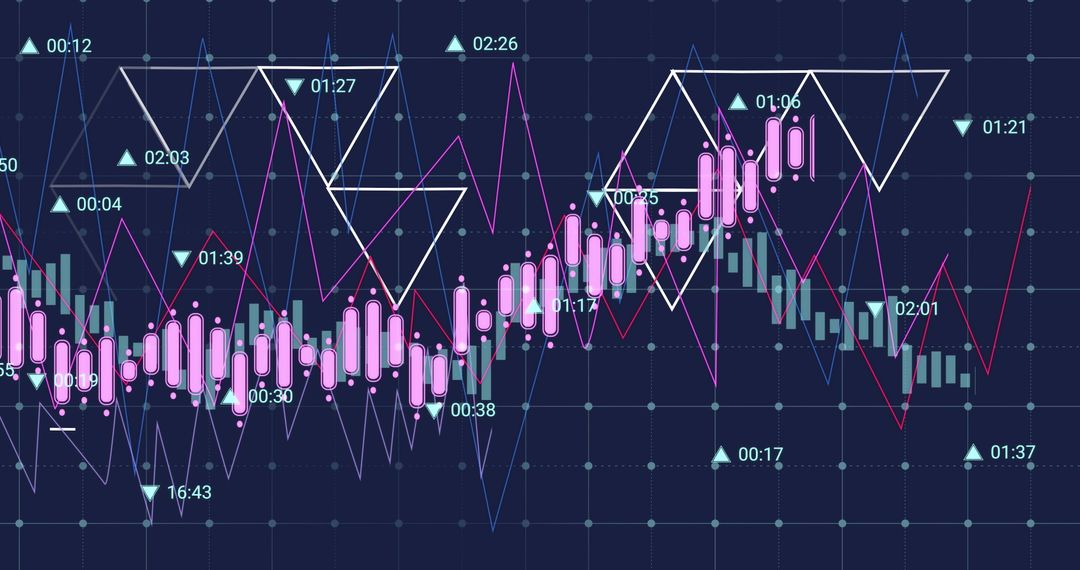
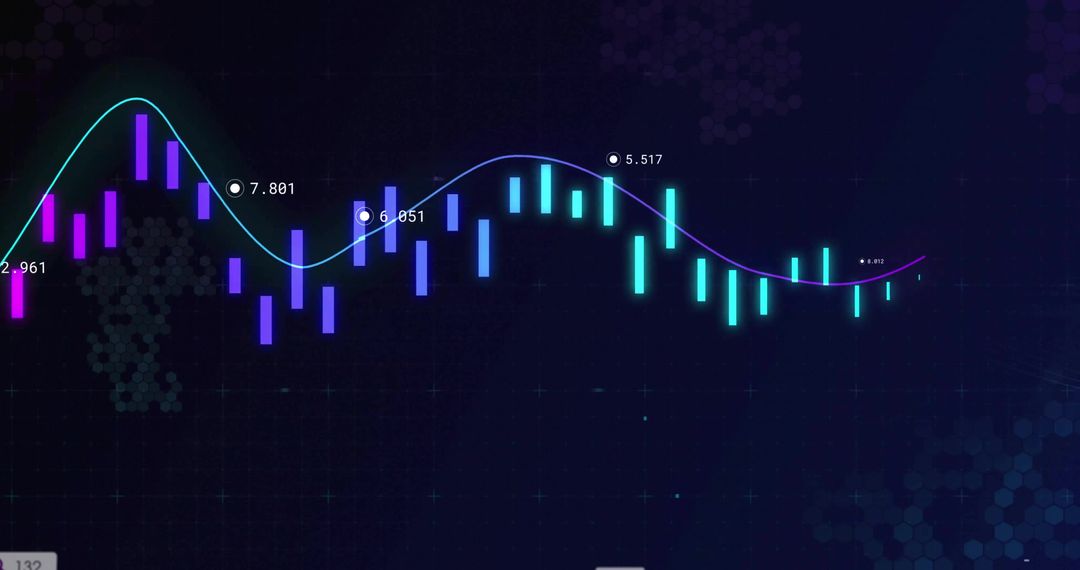
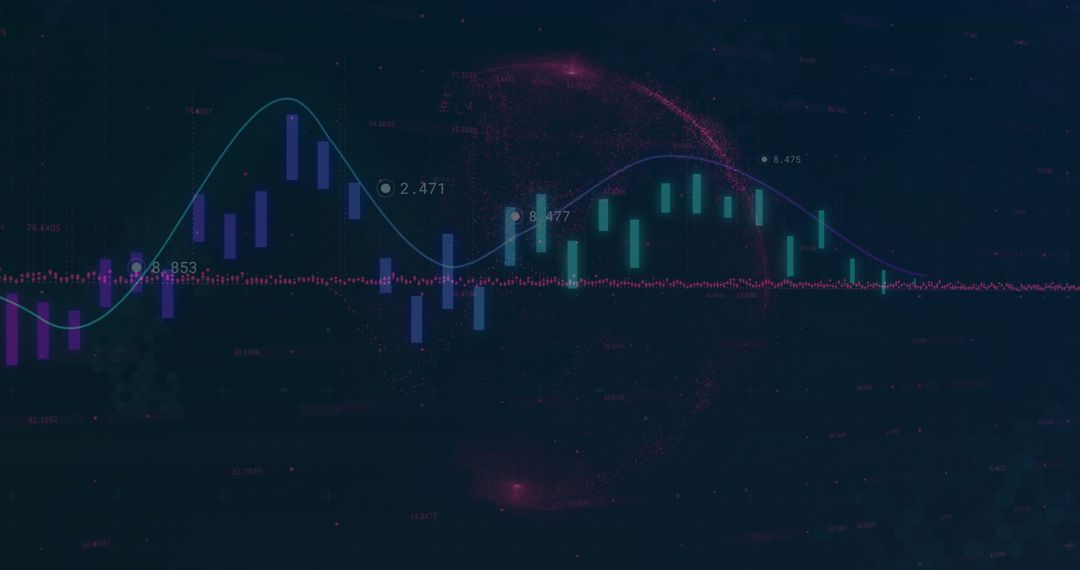
- Neon Candlestick Chart Featuring Moving Averages, Segmented Trendline and Delta Labels on Trading UI
Neon Candlestick Chart Featuring Moving Averages, Segmented Trendline and Delta Labels on Trading UI Image

Showing neon candlesticks with teal and purple hues tracing smooth moving average curves over dark grid, highlighting market momentum and price volatility. Annotating segmented trendline with delta labels and marker boxes, providing clear visual cues for technical analysis and data points. Featuring high-contrast digital aesthetic suitable for fintech branding, trading platform UI, investment reports, blog headers, educational tutorials and social media campaigns. Working well for hero banners, slide covers, dashboard mockups, ad creatives and video overlays. Including room for headline text and data callouts thanks to negative space along top and right edges.
Powered by  - Get 15% off with code: PIKWIZARD15


0
downloads
downloads
Tags:
More
Credit Photo
If you would like to credit the Photo, here are some ways you can do so
Text Link
photo Link
<span class="text-link">
<span>
<a target="_blank" href=https://pikwizard.com/photo/neon-candlestick-chart-featuring-moving-averages-segmented-trendline-and-delta-labels-on-trading-ui/ca93c425f53376ce1266344d78577ea2/>PikWizard</a>
</span>
</span>
<span class="image-link">
<span
style="margin: 0 0 20px 0; display: inline-block; vertical-align: middle; width: 100%;"
>
<a
target="_blank"
href="https://pikwizard.com/photo/neon-candlestick-chart-featuring-moving-averages-segmented-trendline-and-delta-labels-on-trading-ui/ca93c425f53376ce1266344d78577ea2/"
style="text-decoration: none; font-size: 10px; margin: 0;"
>
<img src="https://pikwizard.com/pw/medium/ca93c425f53376ce1266344d78577ea2.jpg" style="margin: 0; width: 100%;" alt="" />
<p style="font-size: 12px; margin: 0;">PikWizard</p>
</a>
</span>
</span>
Free (free of charge)
Free for personal and commercial use.
Author: Creative Art
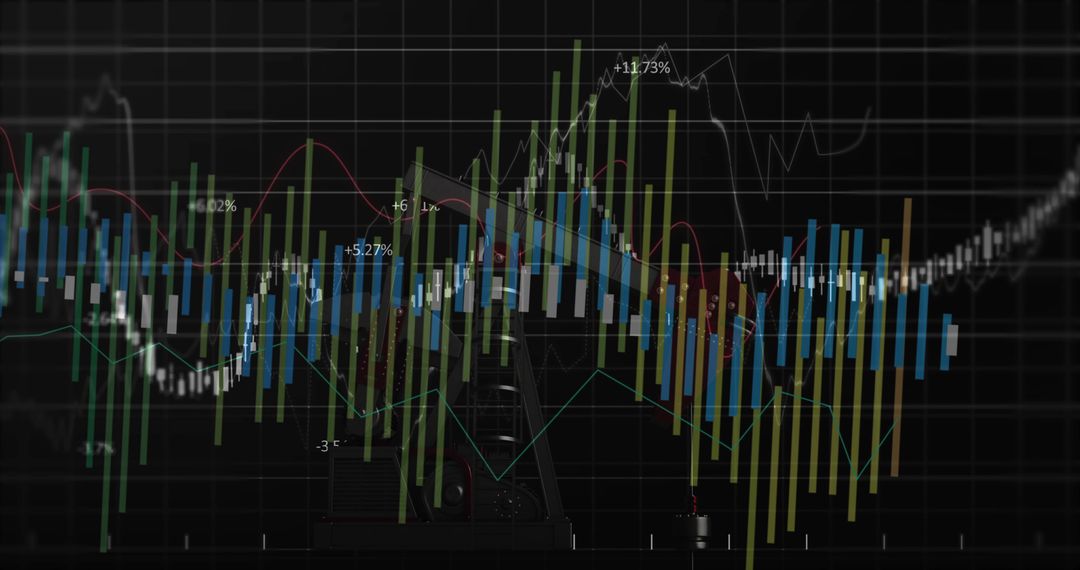
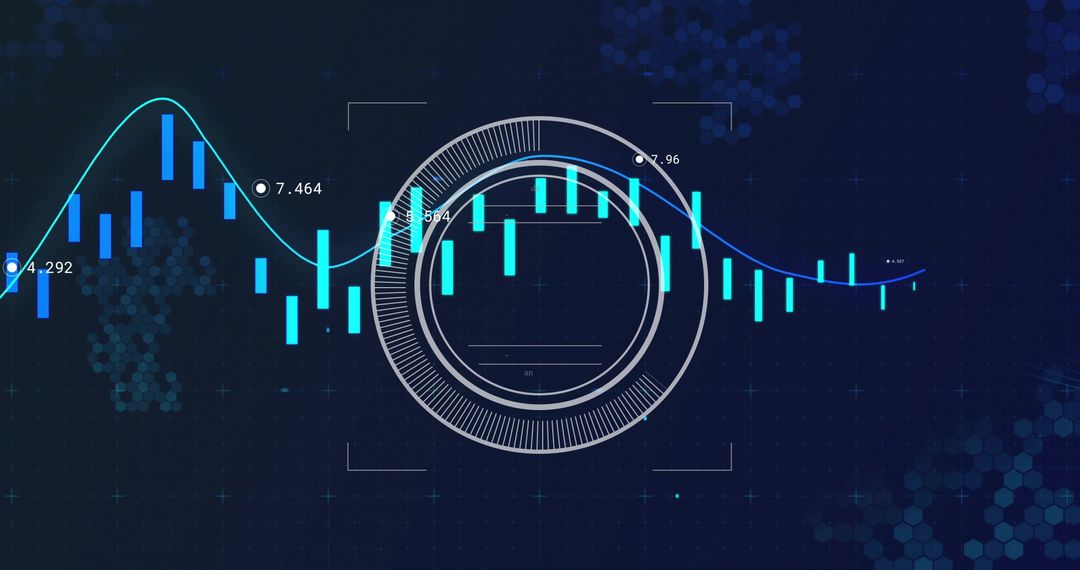
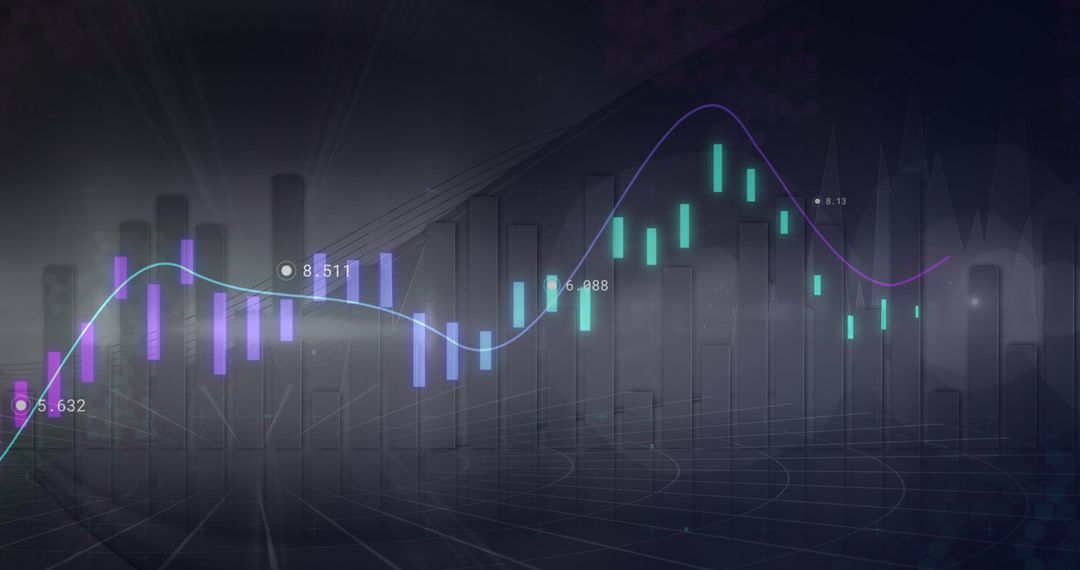
Similar Free Stock Images

Premium


Premium


Premium


Premium


Premium