- Home >
- Stock Photos >
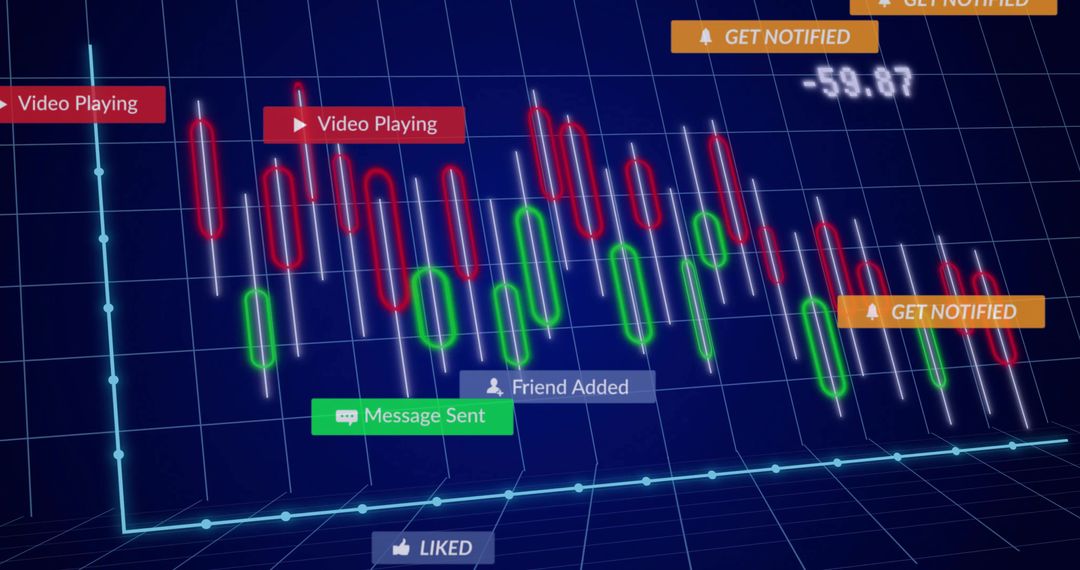
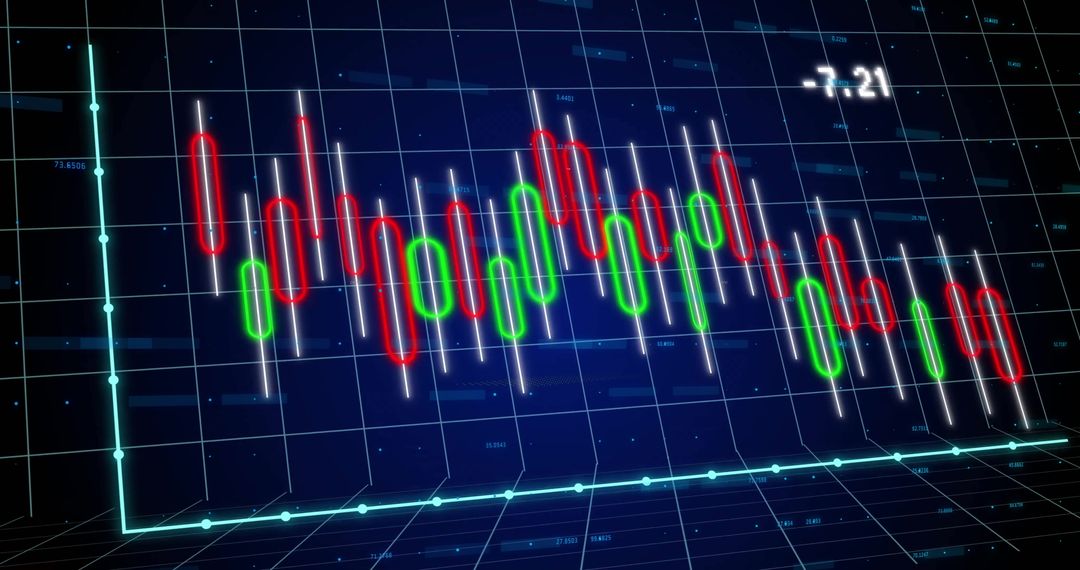
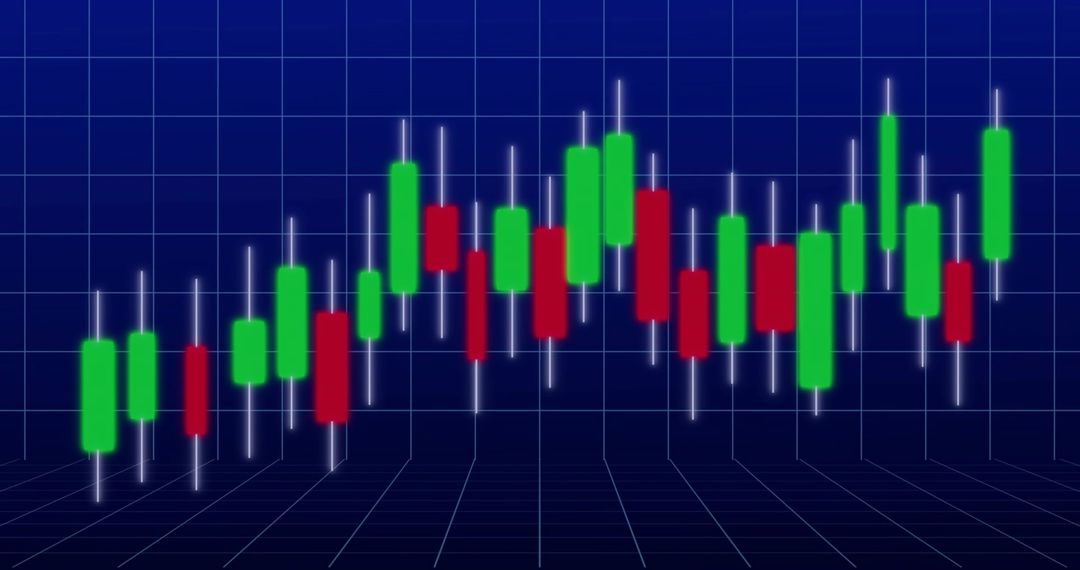
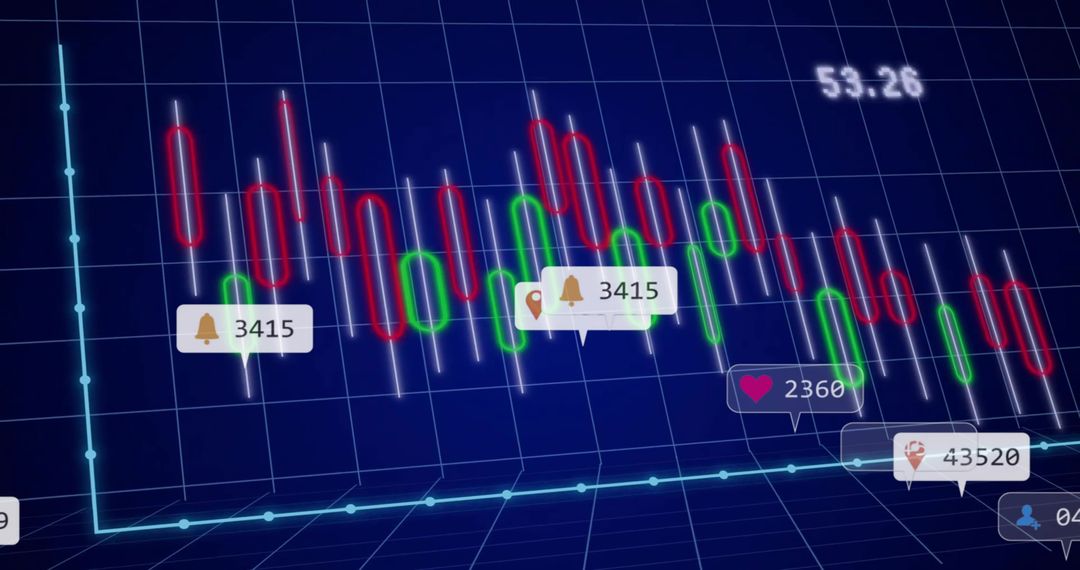
- Neon Candlestick Chart Showing Market Volatility on Futuristic Blue Grid Dashboard
Neon Candlestick Chart Showing Market Volatility on Futuristic Blue Grid Dashboard Image

Showing neon candlestick chart with red and green candles and glowing white wicks on deep blue grid with cyan axis. Featuring neon geometric network elements and numeric readout 53.26, conveying market activity, volatility, bullish and bearish momentum. Ideal for landing page hero for fintech, broker platforms, presentation slide background for market outlook, blog header for trading analysis, social media post about market moves, infographic element for financial reports, background for webinar and online course material. Working well with white or cyan overlay text and minimal typography for clear headline. Providing high contrast for dark theme UI and modern brand visuals, and offering strong visual impact for marketing, editorial, and educational use.
Powered by 


0
downloads
downloads
Tags:
More
Credit Photo
If you would like to credit the Photo, here are some ways you can do so
Text Link
photo Link
<span class="text-link">
<span>
<a target="_blank" href=https://pikwizard.com/photo/neon-candlestick-chart-showing-market-volatility-on-futuristic-blue-grid-dashboard/29ec35dfb0561b055f26ef8613d9d1ed/>PikWizard</a>
</span>
</span>
<span class="image-link">
<span
style="margin: 0 0 20px 0; display: inline-block; vertical-align: middle; width: 100%;"
>
<a
target="_blank"
href="https://pikwizard.com/photo/neon-candlestick-chart-showing-market-volatility-on-futuristic-blue-grid-dashboard/29ec35dfb0561b055f26ef8613d9d1ed/"
style="text-decoration: none; font-size: 10px; margin: 0;"
>
<img src="https://pikwizard.com/pw/medium/29ec35dfb0561b055f26ef8613d9d1ed.jpg" style="margin: 0; width: 100%;" alt="" />
<p style="font-size: 12px; margin: 0;">PikWizard</p>
</a>
</span>
</span>
Free (free of charge)
Free for personal and commercial use.
Author: Authentic Images
Similar Free Stock Images

Premium


Premium


Premium


Premium


Premium


Premium


Premium


Premium


Premium


Premium


Premium


Premium


Premium


Premium


Premium


Premium


Premium


Premium


Premium


Premium


Premium


Premium


Premium


Premium