- Home >
- Stock Photos >
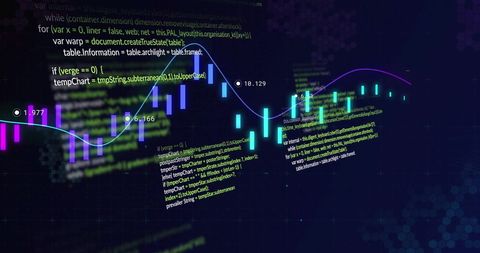
- Neon Candlestick Chart with Codes and Data Visualization Concept
Neon Candlestick Chart with Codes and Data Visualization Concept Image

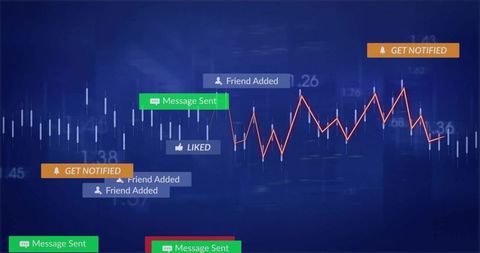
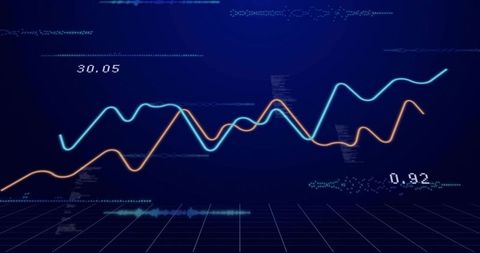
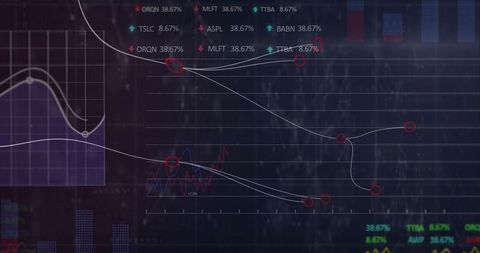
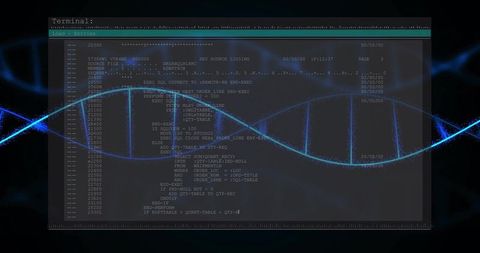
Illustrating a neon-lit candlestick chart full of complex data code in the background. This is prominently used for analyzing financial markets, programming scenarios, and advanced data visualization in futures or stocks. With its futuristic aesthetic, this is ideal for content related to technology, cybersecurity discussions, financial reporting is digital data spheres.

downloads
Tags:
More
Credit Photo
If you would like to credit the Photo, here are some ways you can do so
Text Link
photo Link
<span class="text-link">
<span>
<a target="_blank" href=https://pikwizard.com/photo/neon-candlestick-chart-with-codes-and-data-visualization-concept/ac116d4954f6ec456ddce0b4be0a2f5c/>PikWizard</a>
</span>
</span>
<span class="image-link">
<span
style="margin: 0 0 20px 0; display: inline-block; vertical-align: middle; width: 100%;"
>
<a
target="_blank"
href="https://pikwizard.com/photo/neon-candlestick-chart-with-codes-and-data-visualization-concept/ac116d4954f6ec456ddce0b4be0a2f5c/"
style="text-decoration: none; font-size: 10px; margin: 0;"
>
<img src="https://pikwizard.com/pw/medium/ac116d4954f6ec456ddce0b4be0a2f5c.jpg" style="margin: 0; width: 100%;" alt="" />
<p style="font-size: 12px; margin: 0;">PikWizard</p>
</a>
</span>
</span>
Free (free of charge)
Free for personal and commercial use.
Author: People Creations