
- Home >
- Stock Photos >
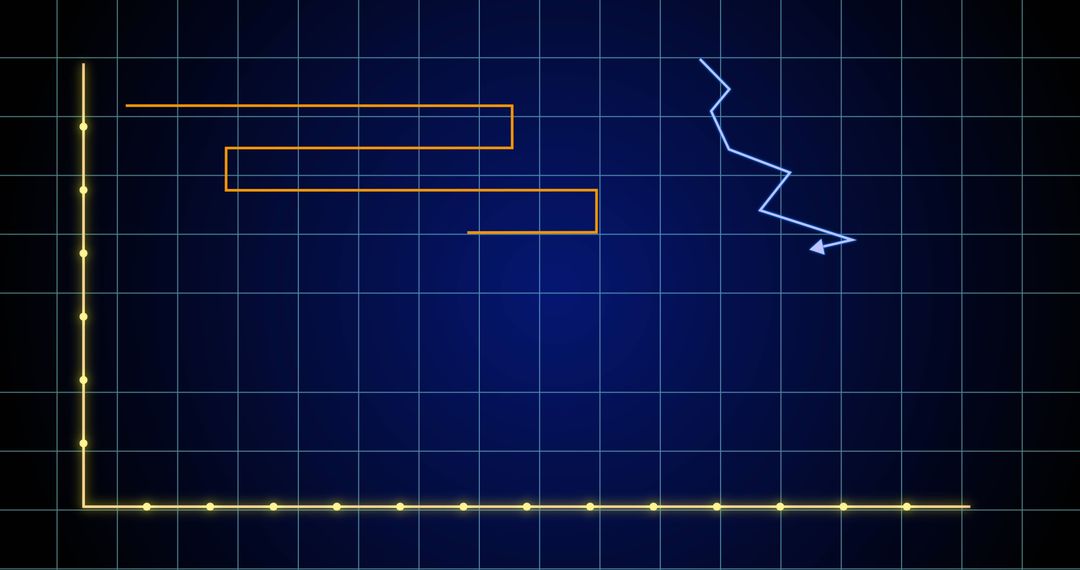
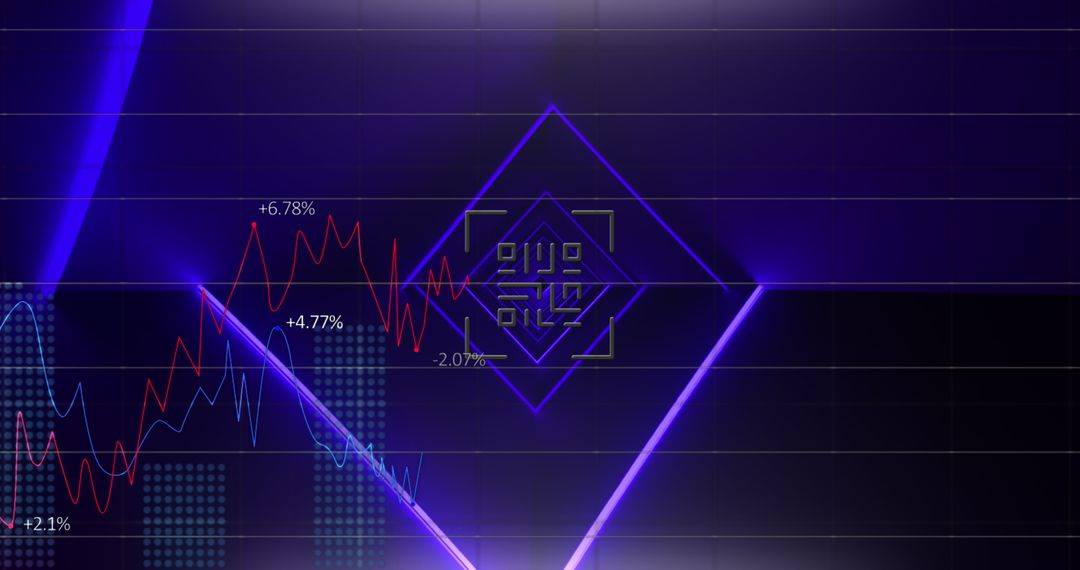
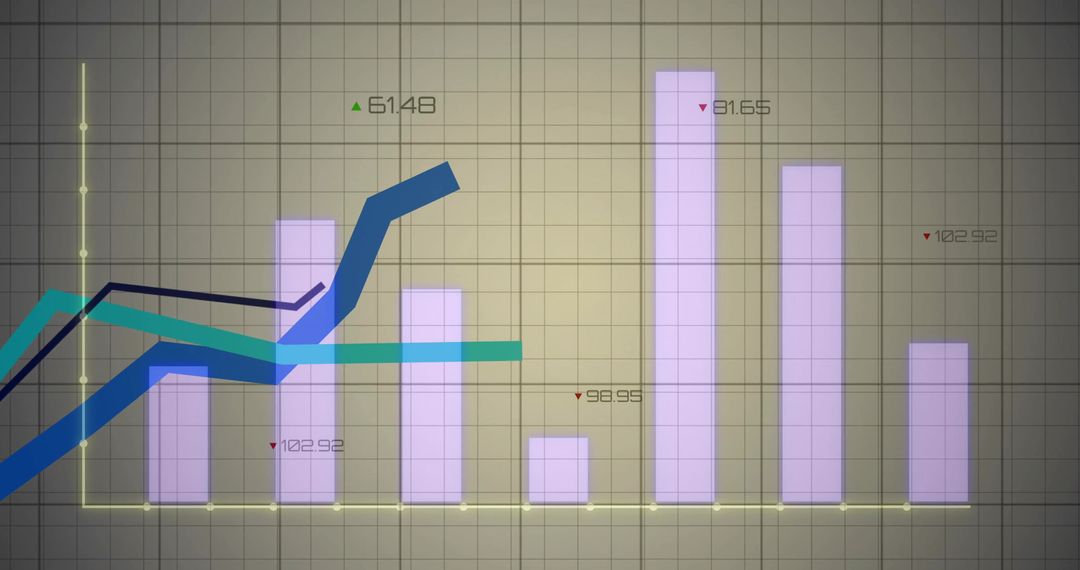
- Neon Data Visualization Showing Teal Rising Trend and Navy Jagged Line on Grid Dashboard
Neon Data Visualization Showing Teal Rising Trend and Navy Jagged Line on Grid Dashboard Image

Showing vivid teal rising trend line intersecting navy jagged line on gridded chart with green and red triangular indicators. Featuring neon glow and soft light trails for futuristic analytics feel. Suiting fintech, business intelligence, investor presentation, quarterly report, blog post on market trends, dashboard mockup, data science article, marketing campaign. Helping illustrate growth trajectory, comparative performance, volatility, forecast models, and visual storytelling. Providing editable space for overlaying text, logo, or data labels. High-contrast composition working well for hero banner, slide background, social media graphic, website header.
Powered by 


0
downloads
downloads
Tags:
More
Credit Photo
If you would like to credit the Photo, here are some ways you can do so
Text Link
photo Link
<span class="text-link">
<span>
<a target="_blank" href=https://pikwizard.com/photo/neon-data-visualization-showing-teal-rising-trend-and-navy-jagged-line-on-grid-dashboard/ddf55312bd1a7d0179678d2bb3ce4433/>PikWizard</a>
</span>
</span>
<span class="image-link">
<span
style="margin: 0 0 20px 0; display: inline-block; vertical-align: middle; width: 100%;"
>
<a
target="_blank"
href="https://pikwizard.com/photo/neon-data-visualization-showing-teal-rising-trend-and-navy-jagged-line-on-grid-dashboard/ddf55312bd1a7d0179678d2bb3ce4433/"
style="text-decoration: none; font-size: 10px; margin: 0;"
>
<img src="https://pikwizard.com/pw/medium/ddf55312bd1a7d0179678d2bb3ce4433.jpg" style="margin: 0; width: 100%;" alt="" />
<p style="font-size: 12px; margin: 0;">PikWizard</p>
</a>
</span>
</span>
Free (free of charge)
Free for personal and commercial use.
Author: Awesome Content
Similar Free Stock Images

Premium


Premium


Premium


Premium


Premium


Premium


Premium


Premium


Premium


Premium


Premium


Premium


Premium


Premium


Premium


Premium


Premium


Premium


Premium


Premium


Premium


Premium


Premium


Premium

