
- Home >
- Stock Photos >
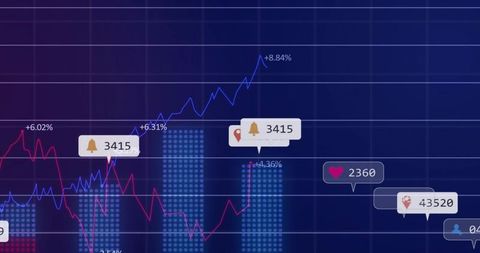
- Neon finance analytics dashboard streaming binary code with volatile line charts
Neon finance analytics dashboard streaming binary code with volatile line charts Image

Showing neon blue and magenta line charts with percent labels overlaying grid and world map dots, suggesting market performance and volatility. Streaming green binary digits across screen, creating Matrix-like tech atmosphere and sense of data flow. Featuring red and blue trend lines with percent callouts, illustrating gains and losses over time for equities, Forex, or crypto dashboards. Suitable for use in fintech websites, trading platform marketing, data science presentations, business reports, technology blog headers. Offering high-impact hero visuals for landing pages, slide decks, social media ads, editorial layouts, promotional banners. Color palette combining deep blues and neon greens, enhancing contrast for headline text and overlay charts. Providing room for adding custom logos, headlines, and numeric overlays with clear legibility for brand messaging and data storytelling.
Powered by 


downloads
Tags:
More
Credit Photo
If you would like to credit the Photo, here are some ways you can do so
Text Link
photo Link
<span class="text-link">
<span>
<a target="_blank" href=https://pikwizard.com/photo/neon-finance-analytics-dashboard-streaming-binary-code-with-volatile-line-charts/0be4fb3218ce0d1db945cf5719b112cd/>PikWizard</a>
</span>
</span>
<span class="image-link">
<span
style="margin: 0 0 20px 0; display: inline-block; vertical-align: middle; width: 100%;"
>
<a
target="_blank"
href="https://pikwizard.com/photo/neon-finance-analytics-dashboard-streaming-binary-code-with-volatile-line-charts/0be4fb3218ce0d1db945cf5719b112cd/"
style="text-decoration: none; font-size: 10px; margin: 0;"
>
<img src="https://pikwizard.com/pw/medium/0be4fb3218ce0d1db945cf5719b112cd.jpg" style="margin: 0; width: 100%;" alt="" />
<p style="font-size: 12px; margin: 0;">PikWizard</p>
</a>
</span>
</span>
Free (free of charge)
Free for personal and commercial use.
Author: Awesome Content
Similar Free Stock Images

Premium


Premium


Premium


Premium


AI


Premium

Premium


Premium


Premium


Premium


Premium


Premium


Premium


Premium

Premium


Premium


Premium


Premium


Premium

Premium


Premium

Premium


AI


Premium


Premium


Premium


Premium


Explore More Free Stock Images