- Home >
- Stock Photos >
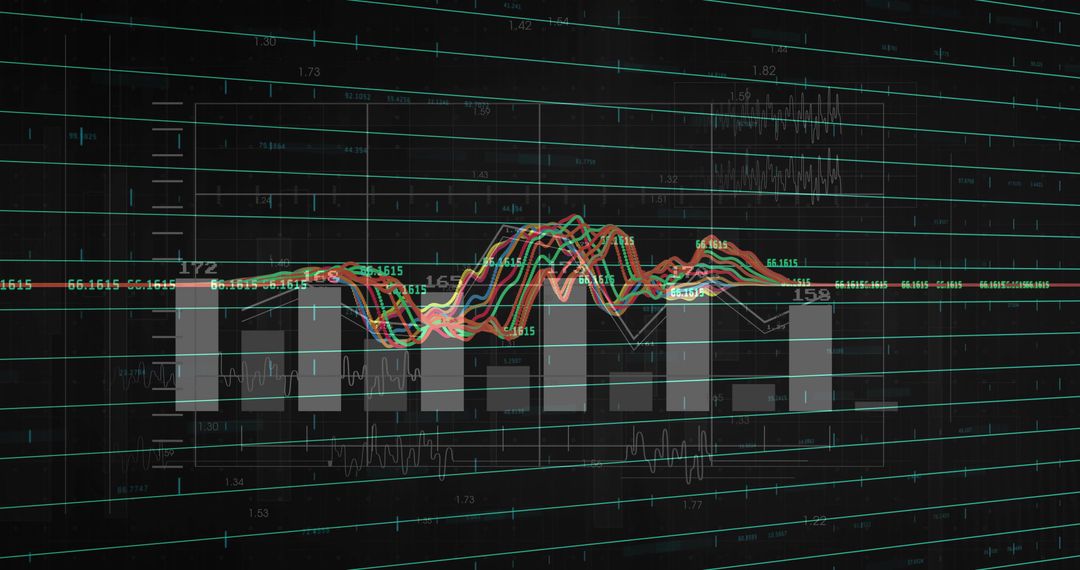
- Neon Financial Dashboard Showing Stock Line Charts, Dotted Histogram Columns and Data Legend
Neon Financial Dashboard Showing Stock Line Charts, Dotted Histogram Columns and Data Legend Image

High-resolution close-up of monitor displaying red and blue line charts, dotted histogram columns, gridlines and percentage labels. Neon color palette and cyber grid presenting modern tech aesthetic ideal for fintech and trading industries. Useful for hero headers, landing pages, presentation slides, social media posts, editorial features on market analysis, and product mockups for financial apps. Composition allows crop for banner or background use, blur lower-left area for text overlay, adjust contrast for print or web. Color contrast and layered elements supporting overlaying of logos, headlines, or data callouts.
Powered by  - Get 15% off with code: PIKWIZARD15


0
downloads
downloads
Tags:
More
Credit Photo
If you would like to credit the Photo, here are some ways you can do so
Text Link
photo Link
<span class="text-link">
<span>
<a target="_blank" href=https://pikwizard.com/photo/neon-financial-dashboard-showing-stock-line-charts-dotted-histogram-columns-and-data-legend/b9eead5f4cd2d3b6adbc4e75eac7b4f5/>PikWizard</a>
</span>
</span>
<span class="image-link">
<span
style="margin: 0 0 20px 0; display: inline-block; vertical-align: middle; width: 100%;"
>
<a
target="_blank"
href="https://pikwizard.com/photo/neon-financial-dashboard-showing-stock-line-charts-dotted-histogram-columns-and-data-legend/b9eead5f4cd2d3b6adbc4e75eac7b4f5/"
style="text-decoration: none; font-size: 10px; margin: 0;"
>
<img src="https://pikwizard.com/pw/medium/b9eead5f4cd2d3b6adbc4e75eac7b4f5.jpg" style="margin: 0; width: 100%;" alt="" />
<p style="font-size: 12px; margin: 0;">PikWizard</p>
</a>
</span>
</span>
Free (free of charge)
Free for personal and commercial use.
Author: People Creations
Similar Free Stock Images

Premium


Premium


Premium


Premium


Premium


Premium


Premium


Premium


Premium


Premium


Premium


Premium


Premium


Premium


Premium


Premium


Premium


Premium


Premium


Premium


Premium


Premium


Premium


Premium