- Home >
- Stock Photos >
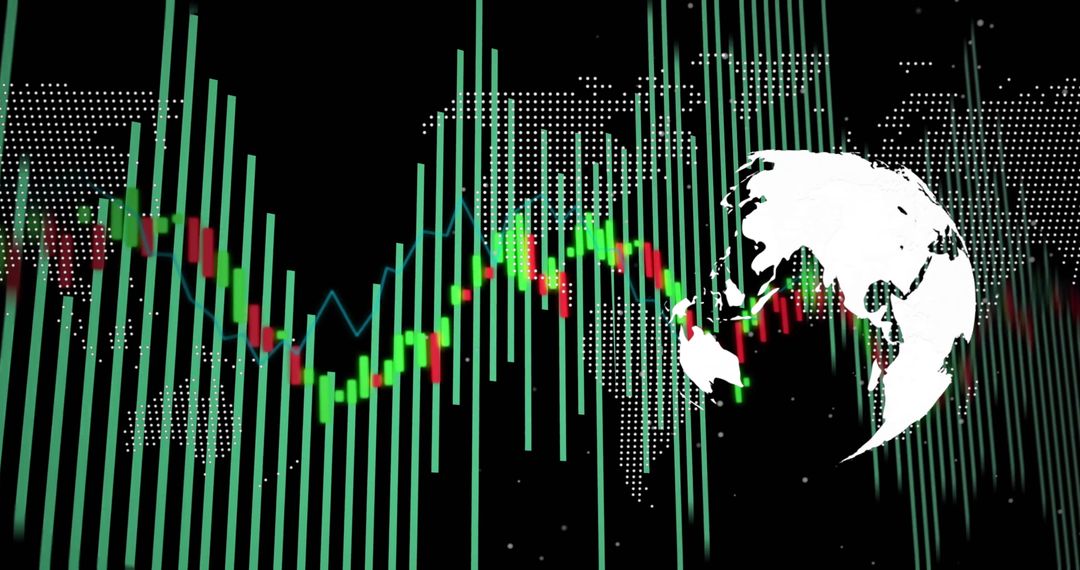
- Neon Financial Market Chart Displaying Candlestick Trends and Dynamic Teal Bar Waveform
Neon Financial Market Chart Displaying Candlestick Trends and Dynamic Teal Bar Waveform Image

Showing neon teal bars, green and red candlesticks, and blue trend line forming dynamic timeseries waveform. Suiting financial and fintech projects including website hero banners, trading platform headers, investor presentations, market analysis reports, social media posts, and educational content. Conveying volatility, momentum, and data-driven decision making for investment and trading narratives. Working well as background for headlines, infographic elements, slide decks, app interfaces, and landing pages. Offering high contrast and futuristic look for modern finance and technology themes. Layering text overlays, logos, and data labels for custom branding and editorial use.
Powered by 


0
downloads
downloads
Tags:
More
Credit Photo
If you would like to credit the Photo, here are some ways you can do so
Text Link
photo Link
<span class="text-link">
<span>
<a target="_blank" href=https://pikwizard.com/photo/neon-financial-market-chart-displaying-candlestick-trends-and-dynamic-teal-bar-waveform/112caf9f8cd34e54acfdf0931b8426e0/>PikWizard</a>
</span>
</span>
<span class="image-link">
<span
style="margin: 0 0 20px 0; display: inline-block; vertical-align: middle; width: 100%;"
>
<a
target="_blank"
href="https://pikwizard.com/photo/neon-financial-market-chart-displaying-candlestick-trends-and-dynamic-teal-bar-waveform/112caf9f8cd34e54acfdf0931b8426e0/"
style="text-decoration: none; font-size: 10px; margin: 0;"
>
<img src="https://pikwizard.com/pw/medium/112caf9f8cd34e54acfdf0931b8426e0.jpg" style="margin: 0; width: 100%;" alt="" />
<p style="font-size: 12px; margin: 0;">PikWizard</p>
</a>
</span>
</span>
Free (free of charge)
Free for personal and commercial use.
Author: Awesome Content
Similar Free Stock Images

Premium


Premium


Premium


Premium


Premium


Premium


Premium


Premium


Premium


Premium


Premium


Premium


Premium


Premium


Premium


Premium


Premium


Premium


Premium


Premium


Premium


Premium


Premium


Premium