
- Home >
- Stock Photos >
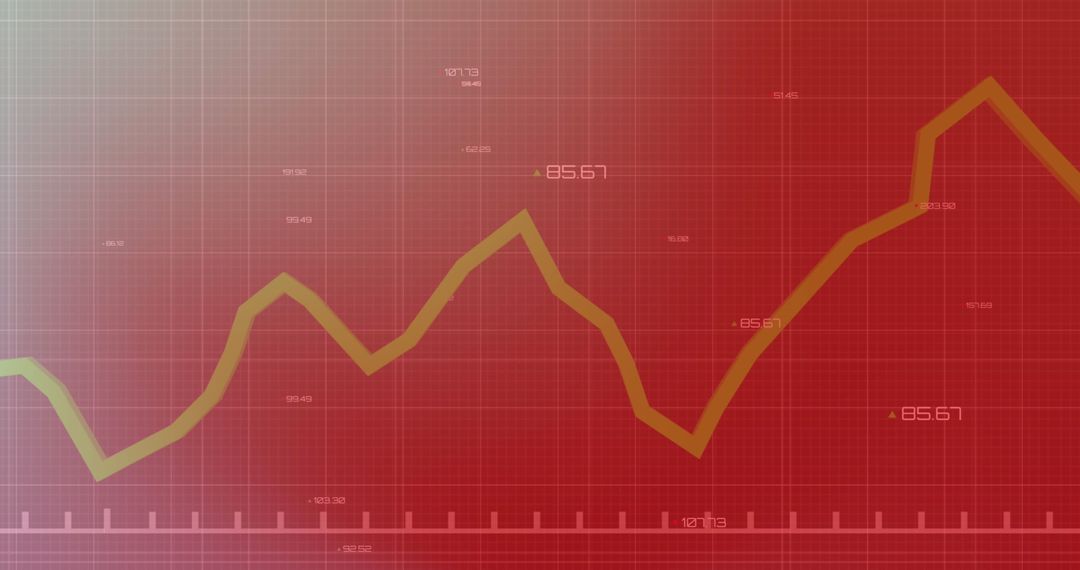
- Neon Graph with Sunset Glow on Digital Grid Background
Neon Graph with Sunset Glow on Digital Grid Background Image
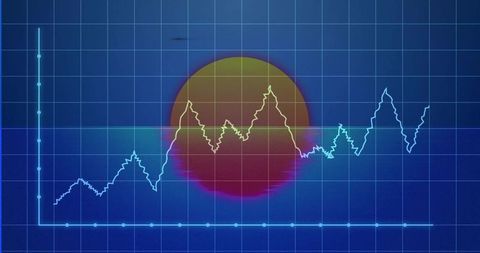
Vibrant neon lines depict fluctuating data on futuristic digital dashboard with dark blue grid and sunset effect, symbolic of analytics tracking and technological advancements. Useful for illustrating business intelligence, science forecasting, or tech innovation themes.
Powered by 


0
downloads
downloads
Tags:
More
Credit Photo
If you would like to credit the Photo, here are some ways you can do so
Text Link
photo Link
<span class="text-link">
<span>
<a target="_blank" href=https://pikwizard.com/photo/neon-graph-with-sunset-glow-on-digital-grid-background/932b511cd4c0b46f88a130f674594ce8/>PikWizard</a>
</span>
</span>
<span class="image-link">
<span
style="margin: 0 0 20px 0; display: inline-block; vertical-align: middle; width: 100%;"
>
<a
target="_blank"
href="https://pikwizard.com/photo/neon-graph-with-sunset-glow-on-digital-grid-background/932b511cd4c0b46f88a130f674594ce8/"
style="text-decoration: none; font-size: 10px; margin: 0;"
>
<img src="https://pikwizard.com/pw/medium/932b511cd4c0b46f88a130f674594ce8.jpg" style="margin: 0; width: 100%;" alt="" />
<p style="font-size: 12px; margin: 0;">PikWizard</p>
</a>
</span>
</span>
Free (free of charge)
Free for personal and commercial use.
Author: Awesome Content
Similar Free Stock Images

Premium


Premium


Premium


Premium


Premium


Premium


Premium


Premium


Premium


Premium


Premium


Premium


Premium


Premium


Premium


Premium


Premium


Premium


Premium


Premium


Premium


Premium


Premium


Premium

