- Home >
- Stock Photos >
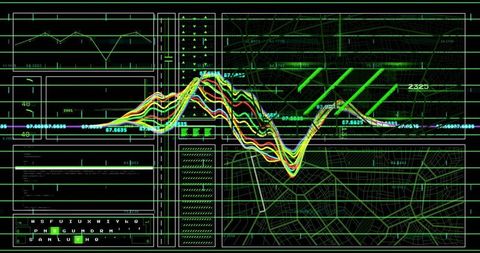
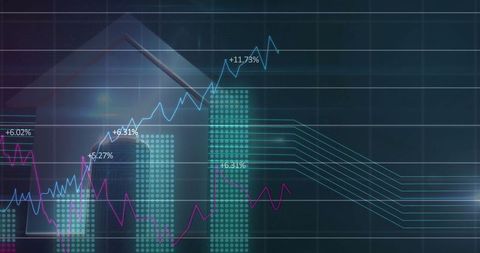
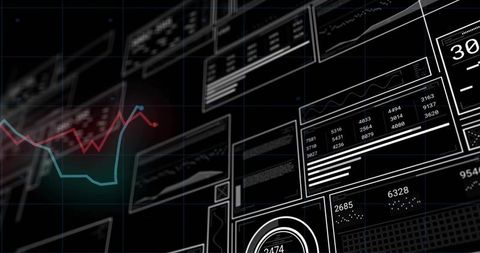
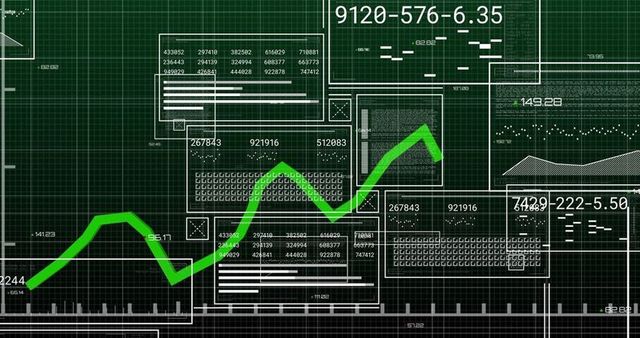
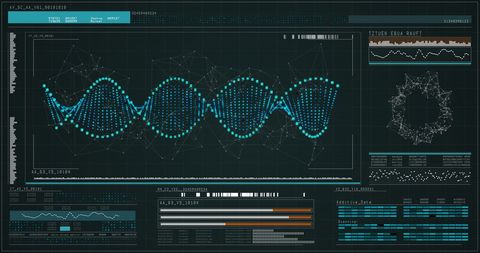
- Neon Graphs on Futuristic Digital Dashboard Interface
Neon Graphs on Futuristic Digital Dashboard Interface Image
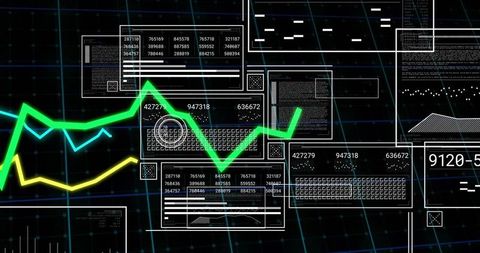
Data visualization interface with neon green and yellow graphs moving across digital dashboard panels. Ideal for illustrating concepts in technology, data analysis, financial markets, digital interfaces, and futuristic development. Highlights analytical pathways and visualization solutions.

downloads
Tags:
More
Credit Photo
If you would like to credit the Photo, here are some ways you can do so
Text Link
photo Link
<span class="text-link">
<span>
<a target="_blank" href=https://pikwizard.com/photo/neon-graphs-on-futuristic-digital-dashboard-interface/0793b7a831f3a5407d358e084d213970/>PikWizard</a>
</span>
</span>
<span class="image-link">
<span
style="margin: 0 0 20px 0; display: inline-block; vertical-align: middle; width: 100%;"
>
<a
target="_blank"
href="https://pikwizard.com/photo/neon-graphs-on-futuristic-digital-dashboard-interface/0793b7a831f3a5407d358e084d213970/"
style="text-decoration: none; font-size: 10px; margin: 0;"
>
<img src="https://pikwizard.com/pw/medium/0793b7a831f3a5407d358e084d213970.jpg" style="margin: 0; width: 100%;" alt="" />
<p style="font-size: 12px; margin: 0;">PikWizard</p>
</a>
</span>
</span>
Free (free of charge)
Free for personal and commercial use.
Author: Awesome Content