- Home >
- Stock Photos >
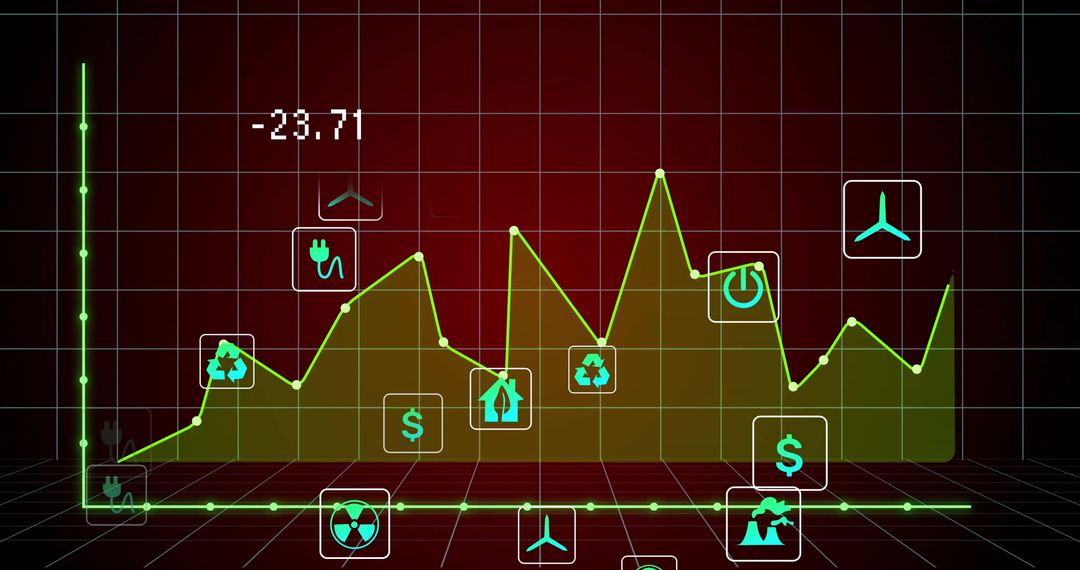
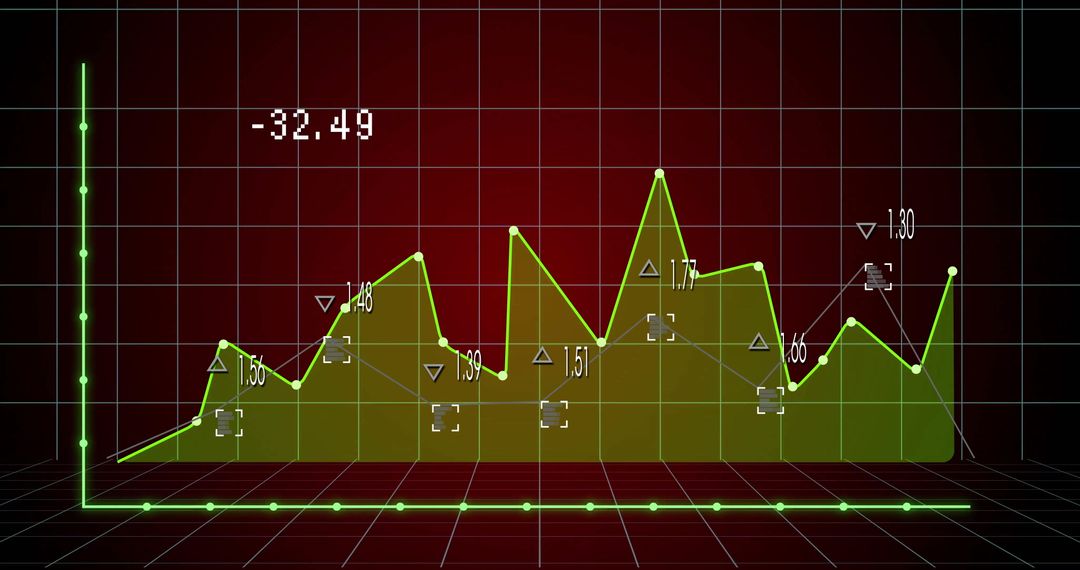
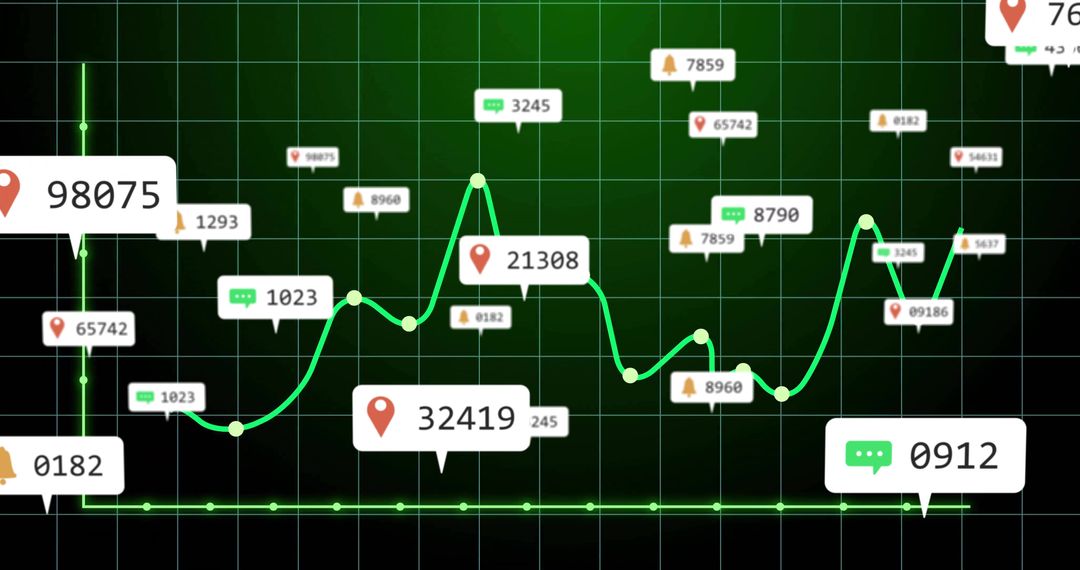
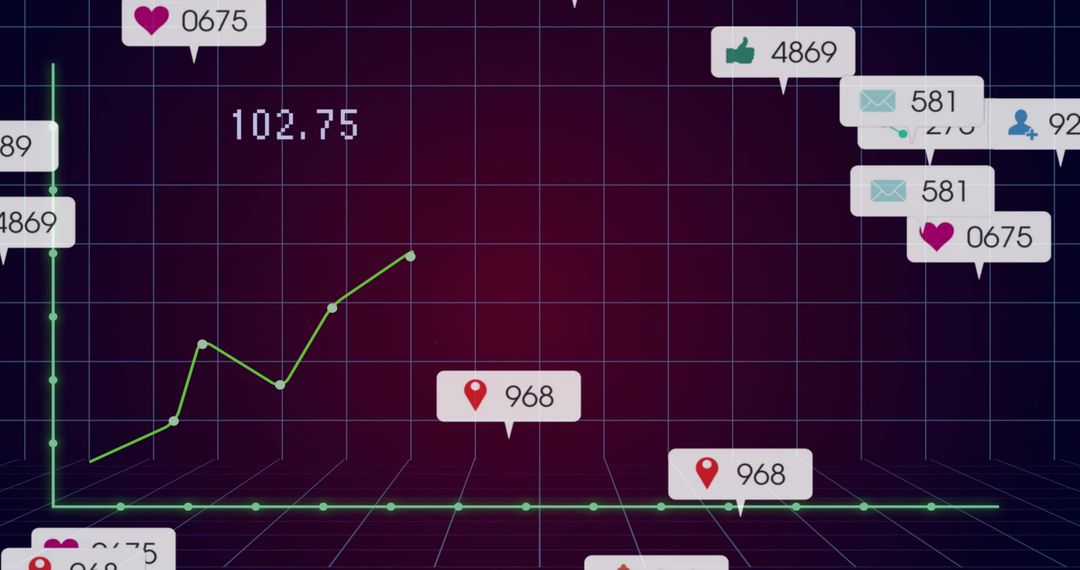
- Neon Green 3D Grid Showing Holo Energy Icons, Financial Nodes and Analytics Dashboard
Neon Green 3D Grid Showing Holo Energy Icons, Financial Nodes and Analytics Dashboard Image

Graphic showing neon green 3D grid with glowing nodes, cyan icon panels, numeric readout 153.68. Visual elements showing wind turbine icon, recycle symbol, nuclear hazard icon, plug and dollar icons placed on tiled floor grid. Style blending holographic HUD and cyberpunk neon palette, creating futuristic tech mood. Serving for renewable energy reports, sustainability presentations, financial analytics dashboards, energy market infographics, website hero banners, slide decks, app UI mockups, marketing campaigns, trade show backdrops. Providing strong focal point for data-driven storytelling, product concept visuals, blog headers. Allowing easy color and overlay adjustments for branding; combining with charts or overlay text for infographic layouts.
Powered by  - Get 15% off with code: PIKWIZARD15


0
downloads
downloads
Tags:
More
Credit Photo
If you would like to credit the Photo, here are some ways you can do so
Text Link
photo Link
<span class="text-link">
<span>
<a target="_blank" href=https://pikwizard.com/photo/neon-green-3d-grid-showing-holo-energy-icons-financial-nodes-and-analytics-dashboard/db782d8430481f3aa535b4bc76ac0d36/>PikWizard</a>
</span>
</span>
<span class="image-link">
<span
style="margin: 0 0 20px 0; display: inline-block; vertical-align: middle; width: 100%;"
>
<a
target="_blank"
href="https://pikwizard.com/photo/neon-green-3d-grid-showing-holo-energy-icons-financial-nodes-and-analytics-dashboard/db782d8430481f3aa535b4bc76ac0d36/"
style="text-decoration: none; font-size: 10px; margin: 0;"
>
<img src="https://pikwizard.com/pw/medium/db782d8430481f3aa535b4bc76ac0d36.jpg" style="margin: 0; width: 100%;" alt="" />
<p style="font-size: 12px; margin: 0;">PikWizard</p>
</a>
</span>
</span>
Free (free of charge)
Free for personal and commercial use.
Author: Authentic Images
Similar Free Stock Images