
- Home >
- Free Stock Photos & Images >
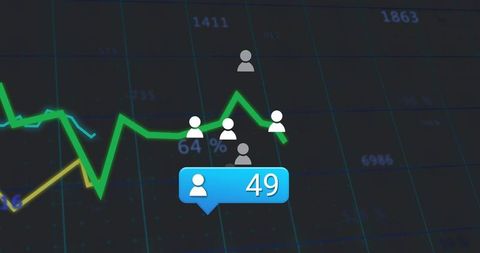
- Neon Green Trend Line Dark Grid Data Visualization with Network Nodes and Social Icons
Neon Green Trend Line Dark Grid Data Visualization with Network Nodes and Social Icons Free Stock Image

Neon green trend line traversing dark gray grid with interconnected network nodes and social icons, illustrating data flow between metrics and user engagement. Visual suiting technology, finance, social media, marketing, analytics content. Serving as dashboard headers, website banners, presentation slides, report covers, blog visuals, and social campaign artwork. Layering space allowing overlaying of text, logos, charts for customized messaging. Color palette emphasizing neon green and cool blues for modern digital aesthetic.
Powered by  - Get 15% off with code: PIKWIZARD15


downloads
Tags:
More
Credit Photo
If you would like to credit the Photo, here are some ways you can do so
Text Link
photo Link
<span class="text-link">
<span>
<a target="_blank" href=https://pikwizard.com/photo/neon-green-trend-line-dark-grid-data-visualization-with-network-nodes-and-social-icons/324ea8ca959faa365dc47ccc309585ea/>PikWizard</a>
</span>
</span>
<span class="image-link">
<span
style="margin: 0 0 20px 0; display: inline-block; vertical-align: middle; width: 100%;"
>
<a
target="_blank"
href="https://pikwizard.com/photo/neon-green-trend-line-dark-grid-data-visualization-with-network-nodes-and-social-icons/324ea8ca959faa365dc47ccc309585ea/"
style="text-decoration: none; font-size: 10px; margin: 0;"
>
<img src="https://thumbs.wbm.im/pw/medium/324ea8ca959faa365dc47ccc309585ea.jpg" style="margin: 0; width: 100%;" alt="Neon Green Trend Line Dark Grid Data Visualization with Network Nodes and Social Icons" />
<p style="font-size: 12px; margin: 0;">PikWizard</p>
</a>
</span>
</span>
Free (free of charge)
Free for personal and commercial use.
Author: Authentic Images
Similar Free Stock Images


Premium


Premium


Premium


Premium


Premium


Premium


Premium


Premium


Premium


Premium


Premium


Premium


Premium


Premium


Premium


Premium


Premium


Premium


Premium


Premium


Premium


Premium


Premium


Premium


Premium

Explore More Free Stock Images