
- Home >
- Free Stock Photos & Images >
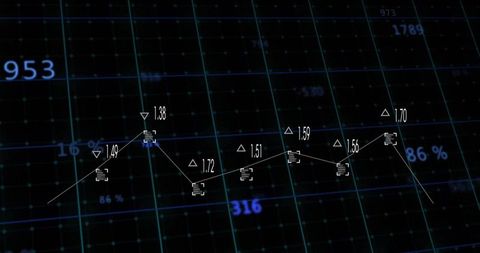
- Streaming data network with interconnected wireframe nodes, neon analytics grid and dashboard
Streaming data network with interconnected wireframe nodes, neon analytics grid and dashboard Free Stock Image

Dark navy grid forming background, faint numeric labels and subtle glowing points adding data context. Central wireframe waveform running horizontally, featuring interconnected circular nodes and thin connecting lines with neon cyan highlights and occasional percent and numeric overlays. Composition emphasizing horizontal motion and depth, leaving negative space for headlines and graphic overlays. Ideal for technology and finance use: enhancing homepage hero sections, illustrating AI and machine learning articles, enriching big data and analytics reports, supporting fintech presentations and investor decks. Color grading and contrast allowing easy text overlay, brand color replacement, and animated parallax or motion-graphic treatments for video or interactive dashboards.
Powered by  - Get 15% off with code: PIKWIZARD15


downloads
Tags:
More
Credit Photo
If you would like to credit the Photo, here are some ways you can do so
Text Link
photo Link
<span class="text-link">
<span>
<a target="_blank" href=https://pikwizard.com/photo/streaming-data-network-with-interconnected-wireframe-nodes-neon-analytics-grid-and-dashboard/6d1b3972417f242900be01884c1bc661/>PikWizard</a>
</span>
</span>
<span class="image-link">
<span
style="margin: 0 0 20px 0; display: inline-block; vertical-align: middle; width: 100%;"
>
<a
target="_blank"
href="https://pikwizard.com/photo/streaming-data-network-with-interconnected-wireframe-nodes-neon-analytics-grid-and-dashboard/6d1b3972417f242900be01884c1bc661/"
style="text-decoration: none; font-size: 10px; margin: 0;"
>
<img src="https://thumbs.wbm.im/pw/medium/6d1b3972417f242900be01884c1bc661.jpg" style="margin: 0; width: 100%;" alt="Streaming data network with interconnected wireframe nodes, neon analytics grid and dashboard" />
<p style="font-size: 12px; margin: 0;">PikWizard</p>
</a>
</span>
</span>
Free (free of charge)
Free for personal and commercial use.
Author: Authentic Images
Similar Free Stock Images


Premium


Premium


Premium


Premium


Premium


Premium


Premium


Premium


Premium


Premium


Premium


Premium


Premium


Premium


Premium


Premium


Premium


Premium


Premium


Premium


Premium


Premium


Premium


Premium


Premium

Explore More Free Stock Images