
- Home >
- Stock Photos >
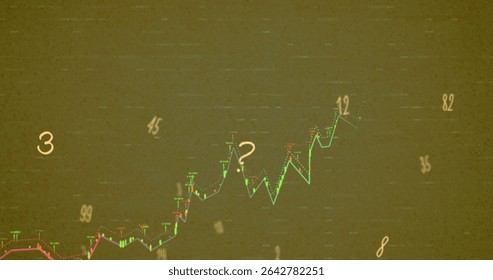
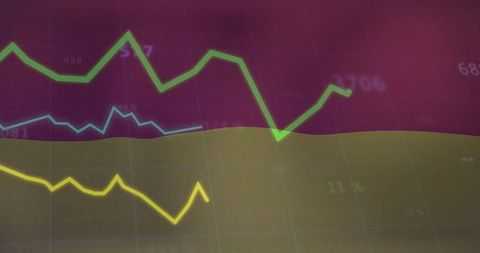
- Neon Line Graph on Trading Interface Displaying Data Analysis
Neon Line Graph on Trading Interface Displaying Data Analysis Image

This image beautifully captures a neon line graph on a trading interface, highlighting real-time fluctuation and data analysis with vibrant colors and numeric labels. It's ideal for use in financial blogs, stock market analysis articles, or visualizations in corporate presentations focused on innovation and technology in the finance sector.
Powered by  - Get 15% off with code: PIKWIZARD15


downloads
Tags:
More
Credit Photo
If you would like to credit the Photo, here are some ways you can do so
Text Link
photo Link
<span class="text-link">
<span>
<a target="_blank" href=https://pikwizard.com/photo/neon-line-graph-on-trading-interface-displaying-data-analysis/8b0fcfd8019f056357991b780287ade1/>PikWizard</a>
</span>
</span>
<span class="image-link">
<span
style="margin: 0 0 20px 0; display: inline-block; vertical-align: middle; width: 100%;"
>
<a
target="_blank"
href="https://pikwizard.com/photo/neon-line-graph-on-trading-interface-displaying-data-analysis/8b0fcfd8019f056357991b780287ade1/"
style="text-decoration: none; font-size: 10px; margin: 0;"
>
<img src="https://pikwizard.com/pw/medium/8b0fcfd8019f056357991b780287ade1.jpg" style="margin: 0; width: 100%;" alt="" />
<p style="font-size: 12px; margin: 0;">PikWizard</p>
</a>
</span>
</span>
Free (free of charge)
Free for personal and commercial use.
Author: Awesome Content
Similar Free Stock Images

Premium


Premium

Premium


Premium


Premium


Premium


Premium


Premium


Premium


Premium


Premium


Premium


Premium


Premium


Premium


Premium


Premium


Premium


Premium


Premium


Premium


Premium


Premium


Premium


Premium


Explore More Free Stock Images