
- Home >
- Stock Photos >
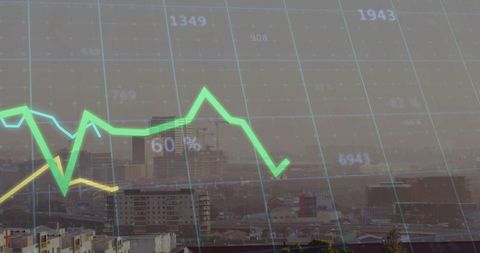
- Neon Line Graphs on Dynamic Data Dashboard for Analytics
Neon Line Graphs on Dynamic Data Dashboard for Analytics Image

Bright neon green and yellow line graphs track financial or analytical data on a sophisticated dashboard. Ideal for illustrating technology, digital analytics, and data-driven decision-making. Perfect for presentations on business intelligence, trends, and innovation strategies.
Powered by  - Get 15% off with code: PIKWIZARD15


downloads
Tags:
More
Credit Photo
If you would like to credit the Photo, here are some ways you can do so
Text Link
photo Link
<span class="text-link">
<span>
<a target="_blank" href=https://pikwizard.com/photo/neon-line-graphs-on-dynamic-data-dashboard-for-analytics/3465efb74d7f9581ec1b0433dd280ac8/>PikWizard</a>
</span>
</span>
<span class="image-link">
<span
style="margin: 0 0 20px 0; display: inline-block; vertical-align: middle; width: 100%;"
>
<a
target="_blank"
href="https://pikwizard.com/photo/neon-line-graphs-on-dynamic-data-dashboard-for-analytics/3465efb74d7f9581ec1b0433dd280ac8/"
style="text-decoration: none; font-size: 10px; margin: 0;"
>
<img src="https://pikwizard.com/pw/medium/3465efb74d7f9581ec1b0433dd280ac8.jpg" style="margin: 0; width: 100%;" alt="" />
<p style="font-size: 12px; margin: 0;">PikWizard</p>
</a>
</span>
</span>
Free (free of charge)
Free for personal and commercial use.
Author: Creative Art
Similar Free Stock Images

Premium


Premium

Premium


Premium


Premium


Premium


Premium


Premium


Premium


Premium


Premium


Premium


Premium


Premium


Premium


Premium


Premium


Premium


Premium


Premium


Premium


Premium


Premium


Premium


Premium


Explore More Free Stock Images