- Home >
- Stock Photos >
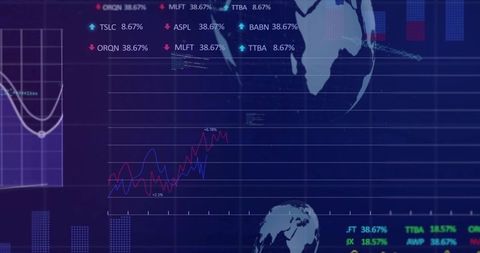
- NFT Trading Analytics Dashboard with Graphs and Data Metrics
NFT Trading Analytics Dashboard with Graphs and Data Metrics Image

Detailed visualization illustrating concept of NFT trading analytics. Graph shows candlestick and line charts with financial data, ideal for finance-themed presentations, digital marketing materials, education content about blockchain and cryptocurrency investments. Insightful for those analyzing economic trends and investment strategies in the cryptocurrency world.

downloads
Tags:
More
Credit Photo
If you would like to credit the Photo, here are some ways you can do so
Text Link
photo Link
<span class="text-link">
<span>
<a target="_blank" href=https://pikwizard.com/photo/nft-trading-analytics-dashboard-with-graphs-and-data-metrics/d84a98cbd71c1d3ca82f6cce4cc0791a/>PikWizard</a>
</span>
</span>
<span class="image-link">
<span
style="margin: 0 0 20px 0; display: inline-block; vertical-align: middle; width: 100%;"
>
<a
target="_blank"
href="https://pikwizard.com/photo/nft-trading-analytics-dashboard-with-graphs-and-data-metrics/d84a98cbd71c1d3ca82f6cce4cc0791a/"
style="text-decoration: none; font-size: 10px; margin: 0;"
>
<img src="https://pikwizard.com/pw/medium/d84a98cbd71c1d3ca82f6cce4cc0791a.jpg" style="margin: 0; width: 100%;" alt="" />
<p style="font-size: 12px; margin: 0;">PikWizard</p>
</a>
</span>
</span>
Free (free of charge)
Free for personal and commercial use.
Author: Awesome Content