
- Home >
- Stock Photos >
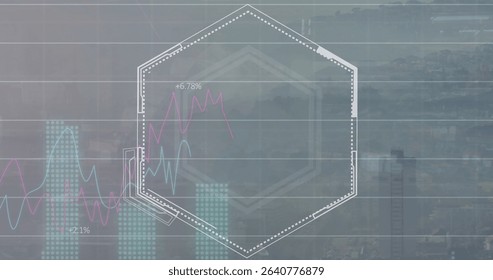
- Optimized Statistical Data Overlain on Corporate Architecture
Optimized Statistical Data Overlain on Corporate Architecture Image

Tall buildings provide a dynamic backdrop to featured data projections, suitable for illustrating economic or financial reports, discussions on business analytics, or content focusing on technological growth and urban economic activity.
Powered by  - Get 15% off with code: PIKWIZARD15


downloads
Tags:
More
Credit Photo
If you would like to credit the Photo, here are some ways you can do so
Text Link
photo Link
<span class="text-link">
<span>
<a target="_blank" href=https://pikwizard.com/photo/optimized-statistical-data-overlain-on-corporate-architecture/70c5bf1465fd3111c90c4b1e055b7cd0/>PikWizard</a>
</span>
</span>
<span class="image-link">
<span
style="margin: 0 0 20px 0; display: inline-block; vertical-align: middle; width: 100%;"
>
<a
target="_blank"
href="https://pikwizard.com/photo/optimized-statistical-data-overlain-on-corporate-architecture/70c5bf1465fd3111c90c4b1e055b7cd0/"
style="text-decoration: none; font-size: 10px; margin: 0;"
>
<img src="https://pikwizard.com/pw/medium/70c5bf1465fd3111c90c4b1e055b7cd0.jpg" style="margin: 0; width: 100%;" alt="" />
<p style="font-size: 12px; margin: 0;">PikWizard</p>
</a>
</span>
</span>
Free (free of charge)
Free for personal and commercial use.
Author: Authentic Images
Similar Free Stock Images

Premium


Premium


Premium


Premium


Premium

Premium


Premium


Premium

Premium


Premium


Premium

Premium

Premium


Premium

Premium


Premium


Premium

Premium

Premium


Premium


Premium


Premium


Premium


Premium


Premium


Explore More Free Stock Images