1. Home > 
  2. Stock Photos > 
  3. Orange pumpkin on teal 3D grid with glowing line chart overlay, futuristic food analytics concept

Orange pumpkin on teal 3D grid with glowing line chart overlay, futuristic food analytics concept Image

Orange pumpkin on teal 3D grid with glowing line chart overlay, futuristic food analytics concept

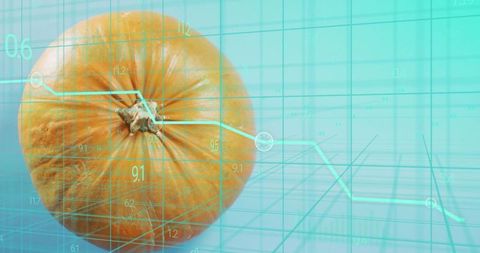
Vivid composition showing orange pumpkin sitting left on teal 3D grid, glowing line chart and numerical overlays floating across frame. Glossy gourd creating contrast between organic form and digital geometry, producing minimalist futuristic aesthetic. Color palette emphasizing orange and turquoise providing strong contrast for bold layouts. Ideal for food tech branding, agricultural analytics, harvest marketing, seasonal promotion, grocery innovation, editorial features on data-driven farming. Suitable for hero banners, website headers, presentation backgrounds, packaging mockups, social media graphics, print editorial spreads.

Powered by Shutterstock logo - Get 15% off with code: PIKWIZARD15
Displaying group of pumpkins sitting on tabletop in room, with world map overlay and data icons. Stilllife, gourds, candles, autumn, bokeh, ambient, digital - Powered by Shutterstock - Get 15% off with code: PIKWIZARD15Displaying pumpkin and gourd cluster sitting on wooden plank with digital HUD overlay, copy space. Flatlay, stilllife, autumn, harvest, rustic, produce, texture - Powered by Shutterstock - Get 15% off with code: PIKWIZARD15Displaying orange pumpkin sitting left in studio with cyan teal line chart, 3D grid, copy space. Gourd, minimalist, glossy, futuristic, digital, display, turquoise - Powered by Shutterstock - Get 15% off with code: PIKWIZARD15

Credit Photo

If you would like to credit the Photo, here are some ways you can do so

Free (free of charge)

Free for personal and commercial use.

Author: People Creations

Similar Free Stock Images

Financial Data Visualization on Graph with Glowing Indicator
Abstract Bitcoin Market Analysis on Futuristic Grid Network
Digital Data Processing with Grid Interface
Global Financial Data and Digital Interface Concept
Analyzing Financial Graphs with Colorful Chart Lines
Global Business Data and Digital Interface Concept
Data Processing Visualization with Code and Graphs
Futuristic Fingerprint Security Digital Interface Technology
Rising Graphs and Interactive Financial Data Analytics Background
Cyber Security Technology in Warehouse Management Systems
Futuristic Data Analysis Dashboard with Virtual Interface
Neon Stadium with Data Graphics on Dark Background
Futuristic Data Processing Interface with Scanning Symbol
Financial Data Analysis with Graph and Connectivity
Dynamic Financial Graphs on Digital Screen Displaying Market Trends
Digital Globe with Cybersecurity Network Overlay
Global Economic Trends with Earth and Data Visualizations
Dynamic Green Graph on Futuristic Technological Interface
Digital Data Streaming Over Planet Earth
Stock Market Decline Data Analysis on Dark Grid Background
Digital Data Interface with Graph and Chart Analysis
Colorful Financial Chart with Heart Icons on Blue Background
Futuristic Digital Globe with Cybersecurity Elements
Futuristic Digital DNA Helix on Abstract Grid Background
Digital Trading Dashboard Visualizing Market Growth with Dual Line Charts and Dotted Bars
Glowing Spotlight on Real-Time Financial Data Analysis
Analyzing Graph Showing Market Economy Stock Crisis
Financial Trends with Power Line Graphic Overlay
Bangladesh Flag Merged with Financial Data for Global Market Concept
Abstract Digital Data Processing and Graph Analysis Interface
Rising Graph with Data and Analysis Objects on Blue Background
Cryptocurrency Growth Chart Over Digital World Map
Digital Interface Showing Financial Data with Security Icon
Holographic Financial Graph with Dynamic Line Chart
Digital Grid Analyzing Financial Data Statistics
Dynamic Data Visualization with Financial Charts and 3D Elements
Neon Stadium and Data Integration in Digital Interface
Global Digital Network with Cyber Coding Sphere
Financial Data and Graphs with Futuristic Interface
Dynamic Data Visualization with Virtual Graphs and Numbers
Secure Data Analytics with Financial Graphs and Padlock Over Ukraine Flag
Digital Data Analytics on Blue Grid Background
Global Financial Graph Showing Decline Indicating Recession
Digital Data Processing Over Email Icon on Dark Background
Armenian Flag with Financial Graph Overlay Depicting Market Trends
Smiling Businesswoman Analyzing Data with Digital Graph Overlay
Line Graph with Data Elements on Purple Grid Interface
Futuristic Green Pound Symbol Amid Financial Data Charts
Digital Analytics Dashboard with Gray Vertical Bars and Line Graphs
Pulsing Circular HUD Overlaying Neon Binary Data Dashboard for Fintech Analytics Visuals
Digital Finance Network with Rotating Globe Interface
Financial Data Analysis with Digital Grid Chart
World Map with Falling Line Graphs Indicating Global Economic Decline
Financial Chart and Rotating Globe on Digital Grid Background
Data Processing Digital Interface with Coding Overlay
Digital Financial Data Charts and Statistics Analysis
Futuristic Financial Data Visualization Powering Investment Decisions
Digital Data with Financial Graphs on Global Grid
Futuristic Financial and Technological Data Visualization Concept
Digital Data Processing with Neon Frame Highlighting Trends
Global Economy Visualization with Data Analytics Concept
Financial Graphs Overlay Virtual Data Office Computers
Digital Financial Graph Illustrating Stock Market Trends
Futuristic Data Analysis Overlaying Cityscape Digital Interface
Digital Fingerprint with Data Overlay on Futuristic Interface
Fluctuating Data Trends Chart with Red and Gray Lines
Green Line Graph Depicting Sustainability and Environmental Icons
Two Businesswomen Analyzing Growing Financial Trends in Office
Financial Stock Market Trends Over Digital Grid Background
Financial Data Analytics with Network Connections on Green Grid
3D Spinning Globe with Financial Analytics and Graphs
Fluctuating Green Line Chart on Digital Futuristic Dashboard
Dynamic Line Graphs Display on Transparent Digital Analytics Screen
Financial Data Visualization with Charts and Graphs Showing Market Trends
Neon Green Line Chart Tracking Global Data Over 3D Globe with Futuristic Analytics HUD
Abstract Digital Globe with Financial Data Interface and Network Connections
Financial Data Visualization with Rising Trends
Digital Dashboard Showing Financial Analysis with Graphs
AI Face Identification with Digital Data Integration
6G Concept with Global Digital Interface on Blue Background
Business Team Analyzing Financial Data with Declining Market Trend
Dynamic Financial Graph Analyzing Market Trends
Digital Data Processing on Globe Interface Background
Dynamic Digital Market Analysis with Holographic Data
Digital Data Analysis Interface with Graphs and Scope
Futuristic Technology Concept with Global Data Visualization
Global Cryptocurrency Trading with Dynamic Data Visualization
3D Rendering of DNA Helix With Digital Data Visualization
Data Analytics with Dynamic Global Market Trends on Screen
Digital Fingerprint Overlayed on Financial Data Illustrating Cybersecurity
Digital Abstract Triangles and Lines on Purple Background
Financial Analytics Across Belarus Economic Landscape
Digital Financial Graphs and Business Analytics on Blue Backdrop
Digital Finance Scope with Data and Bar Graph Elements
Abstract Business Technology Data Presentation
Abstract Digital Line Chart with Multicolored Gradient Overlay
Digital Financial Market Chart Visualization on Trading Screen
Red Trend Line Fluctuating on Digital Chart Grid
Rustic Halloween pumpkin sitting on weathered blue planks with bat cutout and glitch band
Peach and Colorful Candy Merging with Digital Circuitry and Numeric Data Burst Neon Overlay