
- Home >
- Stock Photos >
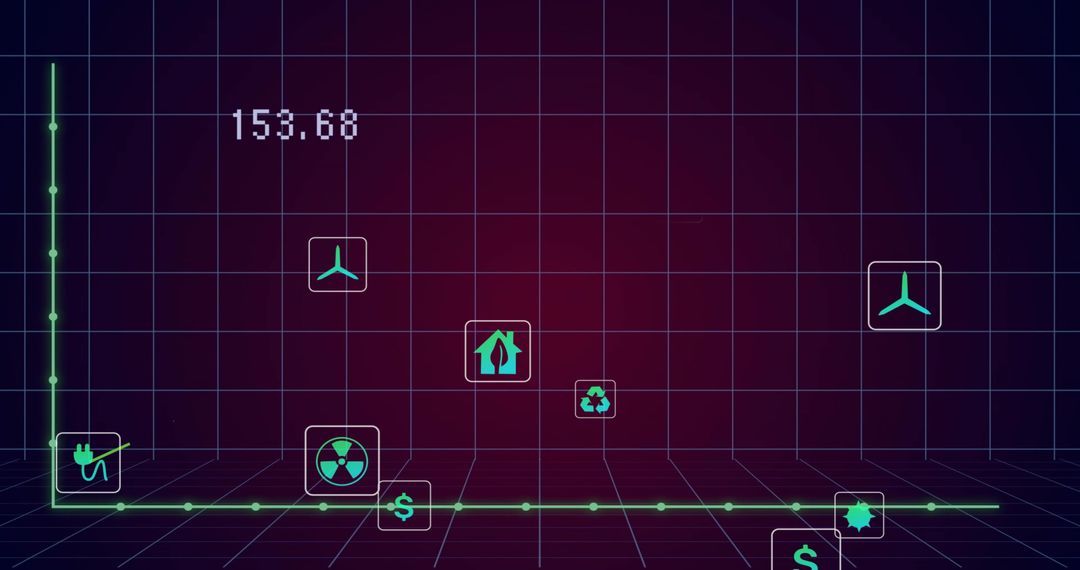
- Orange Step Chart Crossing Dark Blue Grid with Neon Axes and Data Callouts
Orange Step Chart Crossing Dark Blue Grid with Neon Axes and Data Callouts Image
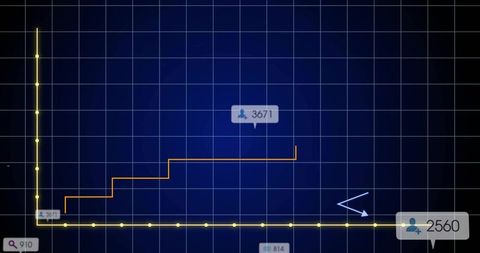
Graphic showing orange stepped line crossing deep blue grid with yellow axis markers, dotted baseline, magnifier icon and arrow pointer directing attention to data callouts 3671 and 2560. Design emphasizing stepwise increases, flatline periods, and highlighted numeric indicators. Ideal for business presentations, analytics dashboards, marketing reports, KPI reviews, and social media posts. Use for illustrating engagement trends, user growth milestones, conversion funnels, or performance alerts. Suggestions for use include layering over dark backgrounds, pairing with white sans-serif headlines, animating line for video intros, cropping for hero headers, and adding branded color accents for reports and slide decks.
Powered by 


0
downloads
downloads
Tags:
More
Credit Photo
If you would like to credit the Photo, here are some ways you can do so
Text Link
photo Link
<span class="text-link">
<span>
<a target="_blank" href=https://pikwizard.com/photo/orange-step-chart-crossing-dark-blue-grid-with-neon-axes-and-data-callouts/f79353dae970c1f68753a7b767573ac2/>PikWizard</a>
</span>
</span>
<span class="image-link">
<span
style="margin: 0 0 20px 0; display: inline-block; vertical-align: middle; width: 100%;"
>
<a
target="_blank"
href="https://pikwizard.com/photo/orange-step-chart-crossing-dark-blue-grid-with-neon-axes-and-data-callouts/f79353dae970c1f68753a7b767573ac2/"
style="text-decoration: none; font-size: 10px; margin: 0;"
>
<img src="https://pikwizard.com/pw/medium/f79353dae970c1f68753a7b767573ac2.jpg" style="margin: 0; width: 100%;" alt="" />
<p style="font-size: 12px; margin: 0;">PikWizard</p>
</a>
</span>
</span>
Free (free of charge)
Free for personal and commercial use.
Author: Authentic Images
Similar Free Stock Images

Premium


Premium


Premium


Premium


Premium


Premium


Premium


Premium


Premium


Premium


Premium


Premium


Premium


Premium


Premium


Premium


Premium


Premium


Premium


Premium


Premium


Premium


Premium


Premium

