- Home >
- Stock Photos >
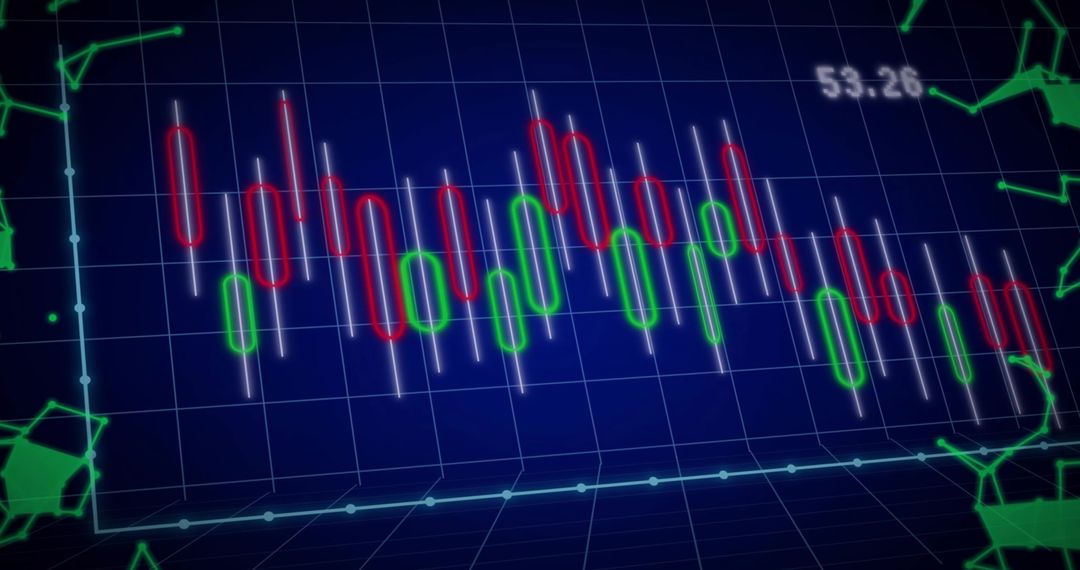
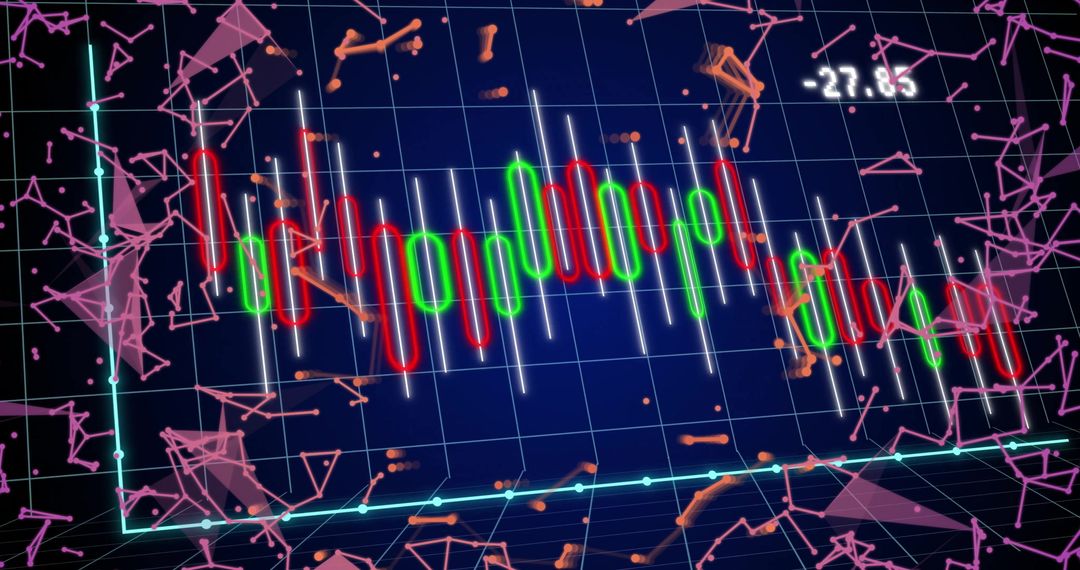
- Oscillating 3D Candlestick Chart on Dark Grid with Glowing Teal Axes and Nodes
Oscillating 3D Candlestick Chart on Dark Grid with Glowing Teal Axes and Nodes Image
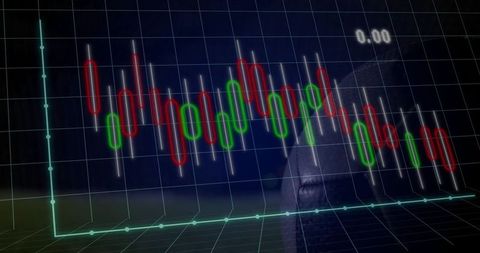
Visualization presenting 3D candlestick chart oscillating across dark grid with glowing teal axes and node highlights. Red and green candlesticks illustrating price movement and volatility with white wicks adding depth and contrast. Faint textured background and perspective grid creating sense of depth and motion. Use cases: Ideal for website headers, landing pages, fintech marketing, trading platform concept art, blog headers, presentation slides, investor reports, educational materials explaining technical analysis. Design notes: High-contrast colors and subtle glow supporting overlay text and data labels, perspective grid allowing cropping for hero banners and thumbnails. Pairing suggestions: Pairing with headlines about market trends, volatility, trading strategies, price forecasts, or fintech product launches to strengthen visual narrative and brand messaging.
Powered by  - Get 15% off with code: PIKWIZARD15


0
downloads
downloads
Tags:
More
Credit Photo
If you would like to credit the Photo, here are some ways you can do so
Text Link
photo Link
<span class="text-link">
<span>
<a target="_blank" href=https://pikwizard.com/photo/oscillating-3d-candlestick-chart-on-dark-grid-with-glowing-teal-axes-and-nodes/18ed18a3154dc5e6b6f78625f89a1a29/>PikWizard</a>
</span>
</span>
<span class="image-link">
<span
style="margin: 0 0 20px 0; display: inline-block; vertical-align: middle; width: 100%;"
>
<a
target="_blank"
href="https://pikwizard.com/photo/oscillating-3d-candlestick-chart-on-dark-grid-with-glowing-teal-axes-and-nodes/18ed18a3154dc5e6b6f78625f89a1a29/"
style="text-decoration: none; font-size: 10px; margin: 0;"
>
<img src="https://pikwizard.com/pw/medium/18ed18a3154dc5e6b6f78625f89a1a29.jpg" style="margin: 0; width: 100%;" alt="" />
<p style="font-size: 12px; margin: 0;">PikWizard</p>
</a>
</span>
</span>
Free (free of charge)
Free for personal and commercial use.
Author: Authentic Images
Similar Free Stock Images

Premium


Premium


Premium


Premium


Premium


Premium


Premium


Premium


Premium


Premium


Premium


Premium


Premium


Premium


Premium


Premium


Premium


Premium


Premium


Premium


Premium


Premium


Premium


Premium