1. Home > 
  2. Stock Photos > 
  3. Overlay of Line Graph Trends on Busy Highway Scene

Overlay of Line Graph Trends on Busy Highway Scene Image

Overlay of Line Graph Trends on Busy Highway Scene

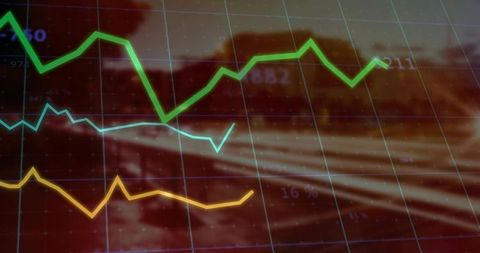
Line graph overlay displaying green, light blue, yellow trends on highway suggests concepts of finance, data analytics, and technology. Climatic numbers and lines evoke ideas of economic trends interacting with transportation systems. Useful for illustrating topics in economic analysis, transport logistics, or technological integration in finance. Effective in presentations, websites, blogs focused on data insights, decision-making strategies, and modern transportation solutions.

Powered by Shutterstock logo - Get 15% off with code: PIKWIZARD15
Digital economic growth chart with a rising trend towards 2025, symbolizing future market predictions. - Powered by Shutterstock - Get 15% off with code: PIKWIZARD15Businessman analysing trading  up trend line graph in bull market, Digital analytics data visualization, financial schedule Currency and Exchange Stock Chart for Finance and Economy Display - Powered by Shutterstock - Get 15% off with code: PIKWIZARD15Showing dashboard plotting line and bar charts on blue grid, with world map and numeric overlays. Analytics, visualization, data, technology, finance, dashboards, growth - Powered by Shutterstock - Get 15% off with code: PIKWIZARD15Displaying chart on grid showing bars and colored lines, percentage labels, candlesticks, red arrow. Data visualization, finance, analytics, technical, digital, modern, dashboard - Powered by Shutterstock - Get 15% off with code: PIKWIZARD15Showing chart with candlestick bars, line graph, labels on screen, hex grid overlay, diagonal bars. Technology, finance, analytics, data, dashboard, visualization, digital - Powered by Shutterstock - Get 15% off with code: PIKWIZARD15

Credit Photo

If you would like to credit the Photo, here are some ways you can do so

Free (free of charge)

Free for personal and commercial use.

Author: Creative Art

Similar Free Stock Images

Abstract Digital Graphs Showing Financial Data Analysis
Premium
Displaying teal dashboard centered on grid, showing HUD icons and dotted line graph trending upward. Analytics, visualization, interface, data, trend, insight, futuristic
Line Graphs on Digital Background Show Financial Data Trends
Futuristic Digital Data Analytics Interface Display
Abstract Financial Data Visualization in Server Room
Dynamic Data Processing With Busy City Background
Premium
Person pointing at glowing financial graph over wooden cubes upward trend data visualization
Futuristic Digital Interface with Dynamic Financial Graph
Digital Financial Data Graph Showcasing Market Trends
Dynamic Stock Market Graphs Over Digital Interface
Analyzing Construction Growth with Digital Charts
Premium
Financial graph with a red falling trend line overlay on a cityscape background, symbolizing a market downturn and financial crisis
Futuristic Digital Graphs with Cityscape Background
Financial Growth Curve Over City Skyline Displaying Business Trends
Financial Data Analysis and Digital Interface Concept
Digital Data Visualization Over Server Rows
Premium
Displaying semi-transparent bar chart overlay over rural crop field, with falling red arrow trend. Data visualization, agricultural, digital, analytics, rural, market, economic
Futuristic Digital Graph Showing Data Trends on Analytic Interface
Futuristic Data Dashboard with Abstract Waveforms and Light Effects
Red Zigzag Graph with Arrow on Green Grid Background
Red Line Graph on Digital Grid Background for Analytics
Premium
Businessperson analyzing financial growth with monthly bar chart and upward trend line on laptop. Concept of business analytics, performance tracking, and data-driven strategy.
Neon Waveform on World Map with Futuristic Data Visuals
Fluctuating Line Graphs on Blue Grid with City Skyline
Server Room Corridor with Graphical Data Overlay
Woman Using VR Headset for Holographic Data Analysis
Premium
Displaying upward-trending bar chart on digital dashboard, with line graph data labels and arrow. Data visualization, analytics, futuristic, tech, intelligence, innovation, data-driven
Futuristic Data Dashboard with Graph and Code Overlay
Abstract Space-Themed Line Graph with Starry Grid
Futuristic Financial Data Analytics with Particle Visualization
Dynamic Financial Data Visualization Dashboard with Global Elements
Abstract Financial Graph with Glowing Node on Grid Background
Dynamic Blockchain Data Chart with Financial Trends Background
Premium
Overlaying red line graph showing numeric labels, triangular bars and upward arrows on dusk skyline. Financial analytics, market trends, data visualization, cityscape, investment growth, digital
Rising Stock Market Graph on Blue Financial Background
Digital Financial Data on Server with Stock Market Graph
Abstract Financial Graph with Rising Waves on Red Gradient
Abstract Digital Graph and Code on Violet Background
Premium
Hands holding a tablet with glowing bar and line charts, global map, and financial data visuals on a dark background. Concept of stock market analytics
Abstract Data Visualization Graph on Blurred Background
Financial Data Analysis with Declining Trends
Digital Finance Chart Overlaying Globe Background
Digital Financial Analysis with Glowing Green Charts
Premium
Dramatic yellow line graph showing peak data trend on black background.
Global Networking Concept with 6G Technology Display
Financial Data Processing with Green Digital Graph in Action
Digital Graph Animation Over Cityscape Reflecting Network Connectivity
Dynamic Financial Data Displays Stock Market Trends
Premium
Digital financial charts overlay Manhattan skyline at night, showcasing glowing graphs, data points, and analysis. Concept of trading and investing
Futuristic Blue Neon Waveform on Digital Interface
Futuristic Growth Hacking Data Analytics Concept
Futuristic Data Visualization Graph Vector Rising Trend
Handcrafting in Workshop with Rising Graph Overlay
Premium
Showing chart at trading platform, with grid overlay, jagged graphs and up arrows, copy space. Financial analytics, data visualization, market trends, digital interface, performance metrics,
Zoom Focused on Dynamic Graph Over Business Workspace
Colorful Financial Chart with Neon Line Graphs and Dynamic Numbers
Colorful Data Line Graphs on Digital Circuit Interface
Neon Green Digital Waveform with Code Background
Premium
Presenting dashboard overlaying skyline silhouette, with bars, line graph, dotted world map, labels. Analytics, data visualization, financial, technology, insight, digital, business
Carpenter Enhancing Plank in Workshop with Growth Chart Superimposed
Financial Charts and Graphs Over Urban Cityscape
Futuristic Digital Cybersecurity with ECG Snap Against Code Screens
Glowing Data Lines on Financial Graph Grid Background
Financial Data Visualization Over Futuristic Cityscape
Business Growth Concept with Graphs Overlay in Warehouse
Premium
Red dotted line graph trending downward across 3D grid in dashboard, with blue point-cloud globe. Data visualization, financial analytics, futuristic design, digital dashboard, global economy, market
Global Economy Displaying Growth Trends with Ukraine-NATO Financial Outlook
Optimized Statistical Data Overlain on Corporate Architecture
Dynamic Stagflation Concept Displaying Economic Burdens
Financial Graph Displayed Over City Skyline at Sunset
Premium
Displaying overlaid wavy line graph trending on dark network dashboard, with tabular data columns. Digital, analytics, visualization, cybersecurity, monitoring, data, interface
Dynamic Business Data and Cityscape Visualization
Rising Financial Data Graph on Digital Grid Background
Financial Data Visual Over London Cityscape
Downward Trend Indicative of Economic Downturn Concepts
Premium
Bar chart and line graph image over cityscape background. Business, finance, analytics, data visualization, growth, trends
Dynamic Financial Graphs Overlaying Urban Skyline
Futuristic Data Graph Overlay on City Skyline
Dynamic Stock Market Chart with Fluctuating Trends and Data Points
Digital Data Processing with Chart in Futuristic Interface
Premium
Rising orange line graph hovering at lakeside dawn, with blue bars, pie chart, numeric labels, grid. Scenic, tranquil, data visualization, analytics, financial, digital art, sunrise
Futuristic Visual Analytics of Environmental Data on Neon Grid
NFT Concept with Dynamic Line Graphs on Digital Grid Background
Metal Fabrication Process with Data Overlay for Manufacturing Analytics
Financial Growth Chart Over Ocean with Green Grid Overlay
Premium
Illuminated bar charts, line graphs, and percentages overlay New York skyline at dusk, reflecting finance and trading concepts
Complex Financial Data Graph with Multicolored Trends and Analytics
Dynamic Financial Data Analytics with Interactive Visual Elements
Futuristic Data Analytics Dashboard with 3D Graph Visualization
Abstract Business Data Visualization with Multiple Line Graphs
Premium
Data insights, charts, and analytics help visualize performance. Data drives strategy, analytics enhances growth, and data improves business outcomes through analytics. Vouch
Financial Dashboard with Line and Bar Graphs for Market Analysis
Futuristic data waveform tracking green trend line across blue helix analytics grid
Futuristic Stock Market Data with Mathematical Formulas
Futuristic Financial Data Analysis in Digital Environment
Global Financial Data Trends Over Electric Grid
Rising Market Trends Green Arrow Chart with Numbers
Premium
Showing chart on trading dashboard, with candlestick, line graphs, percentages, tickers, gridlines. Financial analysis, market trends, data visualization, trading platform, investment, technology,
Dynamic Stock Market Graph Displaying Surging Growth
Digital Interface Display Over Urban Skyline for Financial Analytics
European Market Data Overlay with EU Flag and Financial Graphs
Analyzing Stock Market Trends with Dynamic Graphs and Data
Premium
Displaying green line graph trending on screen with yellow and teal lines, grid overlay, labels. Data analytics, financial analysis, technology, infographic, business intelligence, digital interface,
City Skyline with Overlay of Financial Market Trends
Dynamic Stock Market Visual in Modern Office Setting
Digital Financial Data and Graphs Against World Map Background
Abstract Graphs Over Modern Building at Night
Premium
Displaying bar chart on financial dashboard screen, with overlaid line graphs and percentage labels. Finance, analytics, data visualization, dashboard, investment, market trends, business intelligence
Financial Stock Market Data Visualization with Declining Trends
Digital Stock Market Graph Red Trendline on Green Background
Digital Security In Financial Analytics Showing Data Chart and Padlock
Advanced Financial Charting with Zigzag Indicator and Trends
Premium
Displaying green line graph zigzagging in trading interface with binary digits and numeric labels. Finance, data visualization, technology, analytics, digital, futuristic, business
Modern Data Visualization with Neon Line and Red Histogram on 3D Grid
Pulsating ECG BioData Over Digital Code Matrix
City Skyline with Overlaid Transparent Business Line Graph
Rising Red Line Graph with Stock Market Candlesticks Overlay
Premium
Displaying finance interface showing tickers with percentages and green line graphs in trading room. Technology, data visualization, financial analysis, digital dashboard, corporate, modern,
Dynamic Green Graph on Trading Dashboard Illustrating Market Trends
Professional Analyzing Data on Laptop with Graph Overlay
Tri-Color Line Graph Overlaying Blurred Railway Scene
Futuristic Energy Tracking with Rocket Blueprint and Data Analytics
Premium
Showing grid overlay over city skyline with neon green line graph, yellow line and numeric labels. Technology, finance, urban, data visualization, futuristic, analytics, business
Glowing Neon Red Global Trend Line Chart Showing Market Fluctuations on Digital World Map