
- Home >
- Stock Photos >
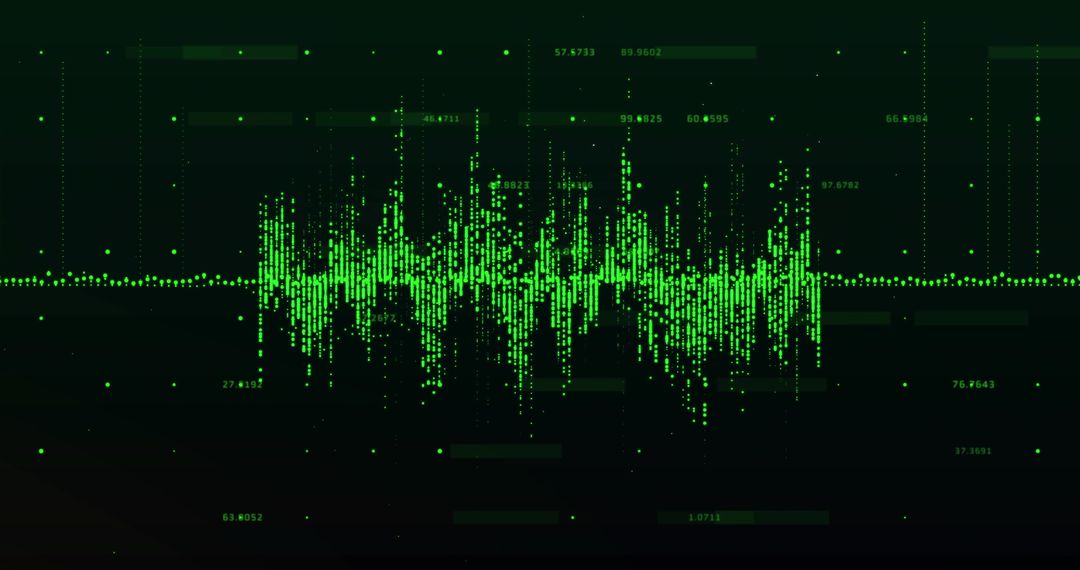
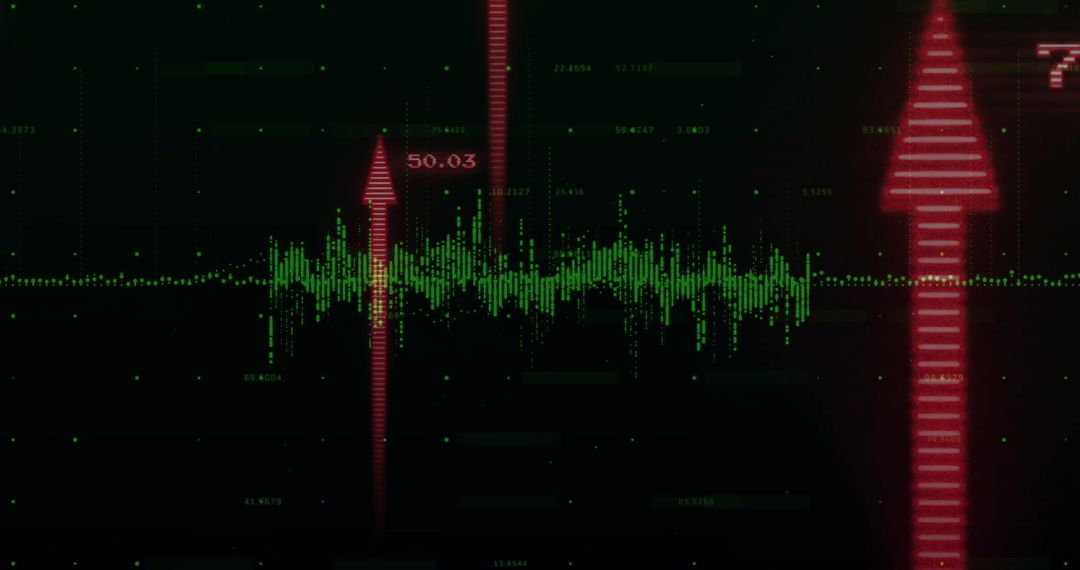
- Pulsing Green Waveform on Holographic Analytics Dashboard, Futuristic Telemetry Visuals
Pulsing Green Waveform on Holographic Analytics Dashboard, Futuristic Telemetry Visuals Image

Pulsing green dotted waveform crossing dark holographic analytics dashboard, layered over multicolor vertical bars and numeric readouts. Isometric perspective creating glossy reflective depth with gridlines and HUD elements. Futuristic telemetry and signal frequency aesthetics conveying real-time data flow and system monitoring. Ideal for illustrating real-time analytics, telemetry, big data dashboards, financial market monitoring, network performance, cybersecurity alerts. Perfect for website headers, app backgrounds, presentation slides, whitepapers, marketing collateral, product landing pages, technology blogs, investor reports. Working well as hero visual, banner, background with overlay text or infographic centerpiece. Color palette supporting neon green accent and deep dark tones for high contrast and dramatic mood. Editable composition allowing easy addition of logos, icons, charts. Recommended for tech startups, finance firms, data science teams, cybersecurity vendors, SaaS products, product demos and investor pitch decks.
Powered by  - Get 15% off with code: PIKWIZARD15


0
downloads
downloads
Tags:
More
Credit Photo
If you would like to credit the Photo, here are some ways you can do so
Text Link
photo Link
<span class="text-link">
<span>
<a target="_blank" href=https://pikwizard.com/photo/pulsing-green-waveform-on-holographic-analytics-dashboard-futuristic-telemetry-visuals/d175c0009c81223c2e43cc82c4c64974/>PikWizard</a>
</span>
</span>
<span class="image-link">
<span
style="margin: 0 0 20px 0; display: inline-block; vertical-align: middle; width: 100%;"
>
<a
target="_blank"
href="https://pikwizard.com/photo/pulsing-green-waveform-on-holographic-analytics-dashboard-futuristic-telemetry-visuals/d175c0009c81223c2e43cc82c4c64974/"
style="text-decoration: none; font-size: 10px; margin: 0;"
>
<img src="https://pikwizard.com/pw/medium/d175c0009c81223c2e43cc82c4c64974.jpg" style="margin: 0; width: 100%;" alt="" />
<p style="font-size: 12px; margin: 0;">PikWizard</p>
</a>
</span>
</span>
Free (free of charge)
Free for personal and commercial use.
Author: People Creations
Similar Free Stock Images

Premium


Premium


Premium


Premium


Premium


Premium


Premium


Premium


Premium


Premium


Premium


Premium


Premium


Premium


Premium


Premium


Premium


Premium


Premium


Premium


Premium


Premium


Premium


Premium

