- Home >
- Stock Photos >
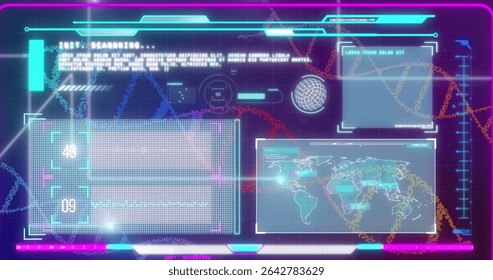
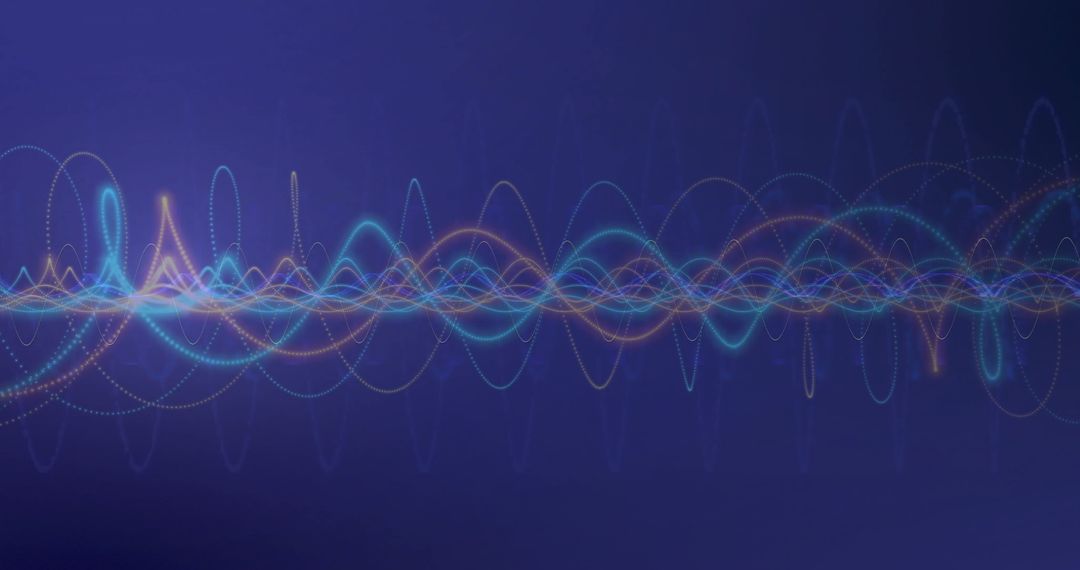
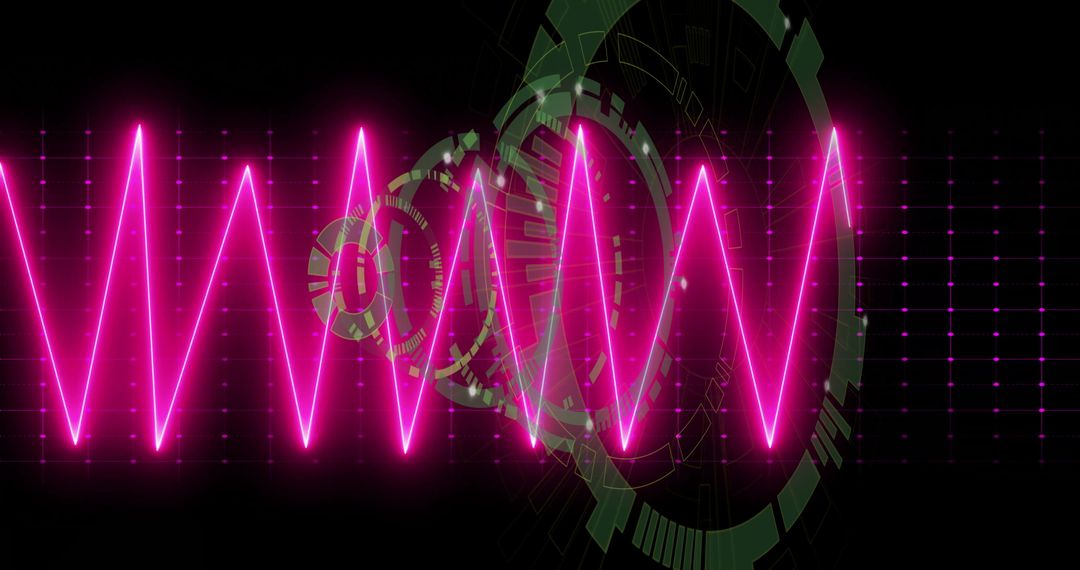
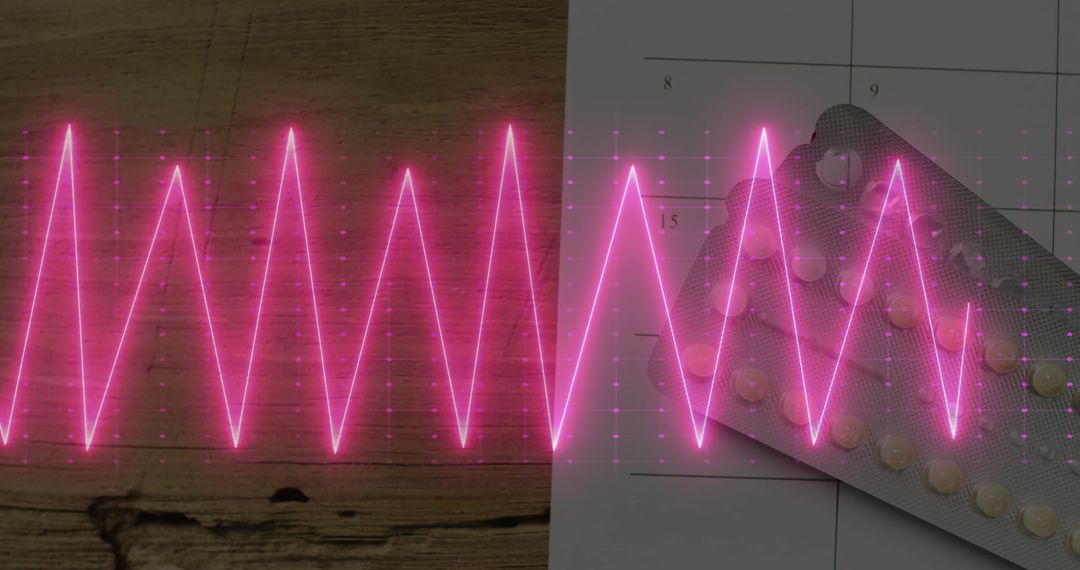
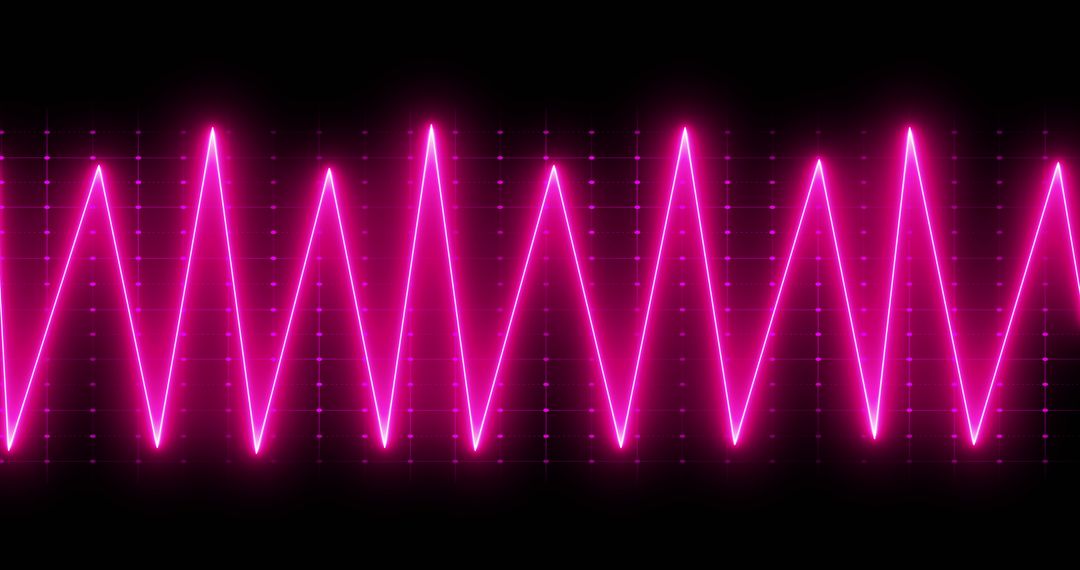
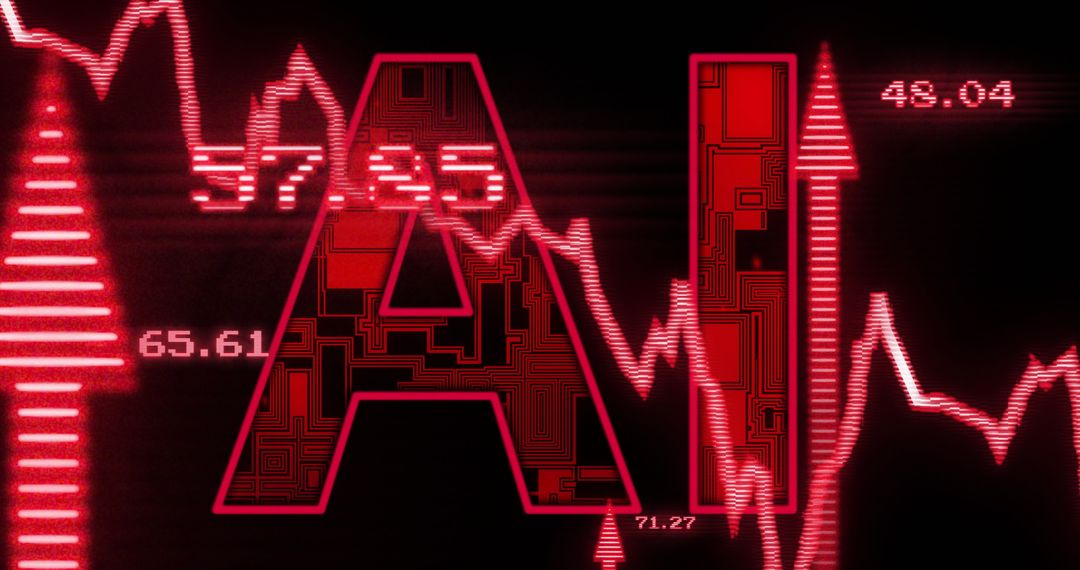
- Pulsing Neon Magenta Waveform Over Dark Data Grid with Holographic Charts
Pulsing Neon Magenta Waveform Over Dark Data Grid with Holographic Charts Image

Pulsing neon magenta waveform crossing dark data grid, showing translucent blue pie charts, vertical bar clusters, thin line plots, numeric labels and HUD-style nodes. Offering high contrast composition and holographic glow, making focal information pop on dark backgrounds. Suiting fintech, analytics, cyber security, tech marketing and digital product presentations. Allowing easy placement of headline text in upper region and call-to-action on lower grid while glowing waveform draws eye. Recommending subtle animation such as waveform pulse, parallax layers or glow flicker for video backgrounds and interactive UI. High-resolution wide aspect ratio fitting 16:9 layouts, working well for website hero banners, dashboard mockups, slide decks, report covers, social media posts and motion graphics.
Powered by  - Get 15% off with code: PIKWIZARD15


0
downloads
downloads
Tags:
More
Credit Photo
If you would like to credit the Photo, here are some ways you can do so
Text Link
photo Link
<span class="text-link">
<span>
<a target="_blank" href=https://pikwizard.com/photo/pulsing-neon-magenta-waveform-over-dark-data-grid-with-holographic-charts/fd9a3c2f3deb013f876148375a699325/>PikWizard</a>
</span>
</span>
<span class="image-link">
<span
style="margin: 0 0 20px 0; display: inline-block; vertical-align: middle; width: 100%;"
>
<a
target="_blank"
href="https://pikwizard.com/photo/pulsing-neon-magenta-waveform-over-dark-data-grid-with-holographic-charts/fd9a3c2f3deb013f876148375a699325/"
style="text-decoration: none; font-size: 10px; margin: 0;"
>
<img src="https://pikwizard.com/pw/medium/fd9a3c2f3deb013f876148375a699325.jpg" style="margin: 0; width: 100%;" alt="" />
<p style="font-size: 12px; margin: 0;">PikWizard</p>
</a>
</span>
</span>
Free (free of charge)
Free for personal and commercial use.
Author: Awesome Content
Similar Free Stock Images

Premium


Premium


Premium


Premium


Premium