- Home >
- Stock Photos >
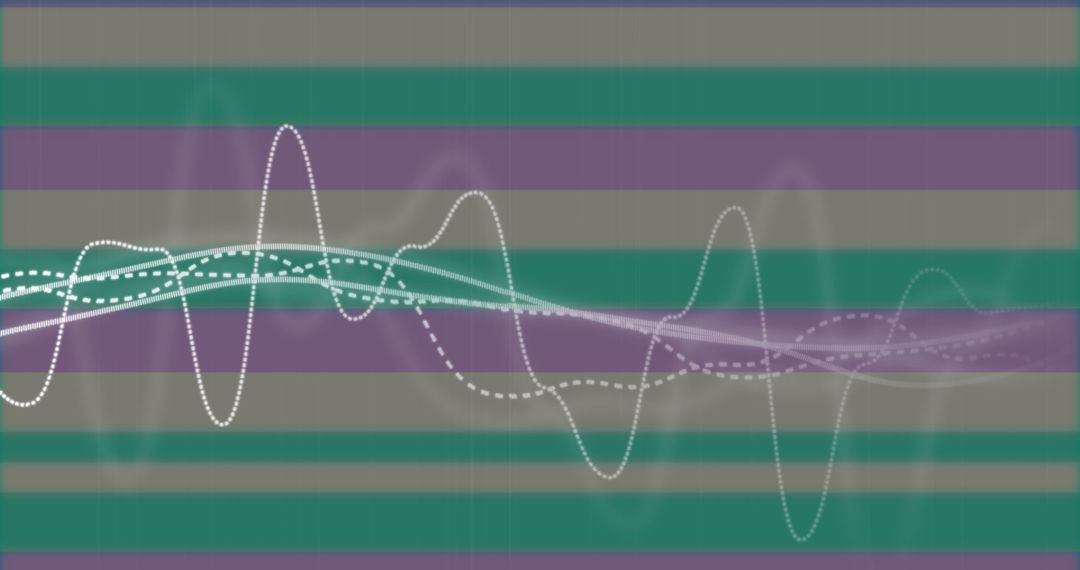
- Purple DNA Helix Overlaid with Financial Data Graphs and Biotech Analytics Dashboard
Purple DNA Helix Overlaid with Financial Data Graphs and Biotech Analytics Dashboard Image

Featuring purple DNA helix sweeping across grid with magenta and light-blue line graphs and percent-change markers (+6.65%, +2.1%). Combining biotech visual with financial analytics to convey genomic market trends, investment in life sciences, and data-driven research. Providing strong focal area for headline, chart overlays, or logo placement while leaving negative space for text. Suitable for presentations, investor decks, blog headers, industry reports, scientific communications, and marketing materials for biotech startups or financial analysis firms. Consider cropping for banner or hero usage and adjusting opacity of graphs for clearer foreground text.
Powered by  - Get 15% off with code: PIKWIZARD15


0
downloads
downloads
Tags:
More
Credit Photo
If you would like to credit the Photo, here are some ways you can do so
Text Link
photo Link
<span class="text-link">
<span>
<a target="_blank" href=https://pikwizard.com/photo/purple-dna-helix-overlaid-with-financial-data-graphs-and-biotech-analytics-dashboard/30c1f9d1a28be54aad54d5219dd3bc01/>PikWizard</a>
</span>
</span>
<span class="image-link">
<span
style="margin: 0 0 20px 0; display: inline-block; vertical-align: middle; width: 100%;"
>
<a
target="_blank"
href="https://pikwizard.com/photo/purple-dna-helix-overlaid-with-financial-data-graphs-and-biotech-analytics-dashboard/30c1f9d1a28be54aad54d5219dd3bc01/"
style="text-decoration: none; font-size: 10px; margin: 0;"
>
<img src="https://pikwizard.com/pw/medium/30c1f9d1a28be54aad54d5219dd3bc01.jpg" style="margin: 0; width: 100%;" alt="" />
<p style="font-size: 12px; margin: 0;">PikWizard</p>
</a>
</span>
</span>
Free (free of charge)
Free for personal and commercial use.
Author: Creative Art
Similar Free Stock Images

Premium


Premium


Premium


Premium


Premium


Premium


Premium


Premium


Premium


Premium


Premium


Premium


Premium


Premium


Premium


Premium


Premium


Premium


Premium


Premium


Premium


Premium


Premium


Premium