
- Home >
- Stock Photos >
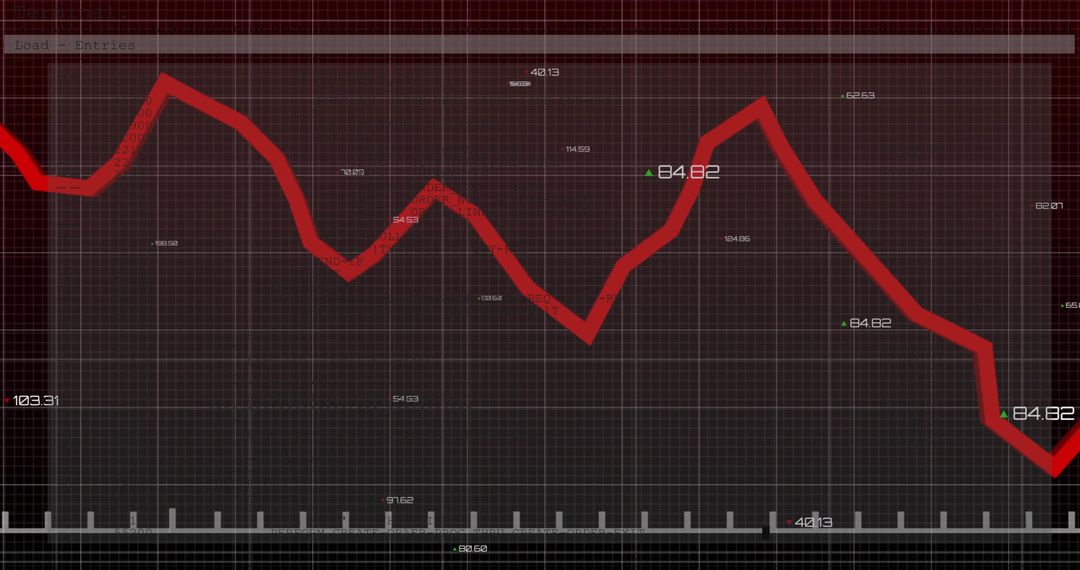
- Red Downtrend Line Falling Across Digital Financial Dashboard With Teal Indicator Dots
Red Downtrend Line Falling Across Digital Financial Dashboard With Teal Indicator Dots Image

Showing high-contrast digital financial dashboard with red jagged downtrend line cutting across dark grid, teal dotted indicator series, and numeric axis labels in strong perspective. Conveying market decline, volatility, and data-driven analysis. Suitable for news headlines, market reports, investment presentations, blog headers, social media posts, financial advertising, and training materials. Using to illustrate topics such as stock sell-off, portfolio loss, risk management, market correction, or economic downturn. Supporting urgent messaging with bold red line and cool teal highlights, while negative space near bottom-right is providing room for headline or logo overlay. Cropping suggestions: tight crop on red line for dramatic emphasis, wide crop for full dashboard context.
Powered by 


0
downloads
downloads
Tags:
More
Credit Photo
If you would like to credit the Photo, here are some ways you can do so
Text Link
photo Link
<span class="text-link">
<span>
<a target="_blank" href=https://pikwizard.com/photo/red-downtrend-line-falling-across-digital-financial-dashboard-with-teal-indicator-dots/39b0aa385fc2d99d68f8f535c7b887fb/>PikWizard</a>
</span>
</span>
<span class="image-link">
<span
style="margin: 0 0 20px 0; display: inline-block; vertical-align: middle; width: 100%;"
>
<a
target="_blank"
href="https://pikwizard.com/photo/red-downtrend-line-falling-across-digital-financial-dashboard-with-teal-indicator-dots/39b0aa385fc2d99d68f8f535c7b887fb/"
style="text-decoration: none; font-size: 10px; margin: 0;"
>
<img src="https://pikwizard.com/pw/medium/39b0aa385fc2d99d68f8f535c7b887fb.jpg" style="margin: 0; width: 100%;" alt="" />
<p style="font-size: 12px; margin: 0;">PikWizard</p>
</a>
</span>
</span>
Free (free of charge)
Free for personal and commercial use.
Author: Awesome Content
Similar Free Stock Images

Premium


Premium


Premium


Premium


Premium


Premium


Premium


Premium


Premium


Premium


Premium


Premium


Premium


Premium


Premium


Premium


Premium


Premium


Premium


Premium


Premium


Premium


Premium


Premium

