
- Home >
- Stock Photos >
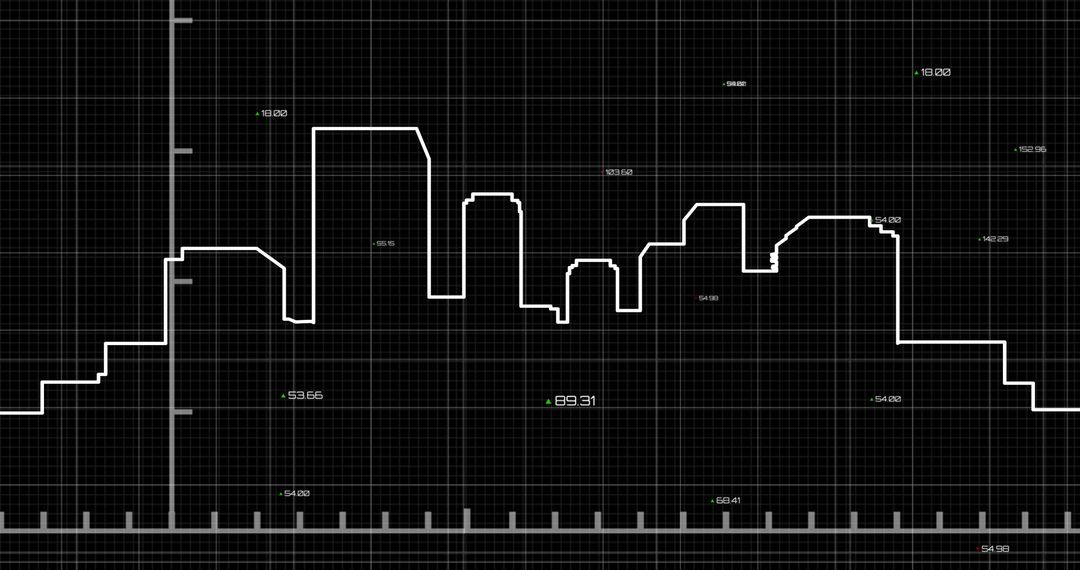
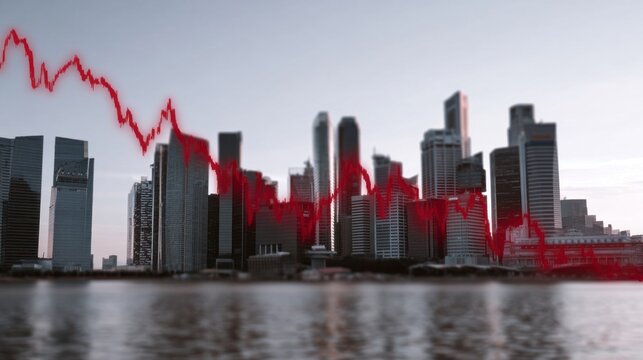
- Red Line Graph Over Histogram Representing Financial Volatility
Red Line Graph Over Histogram Representing Financial Volatility Image

Features graphical representation of financial data including a red line graph over a histogram. Represents financial market analysis and stock market trends. Useful for illustrating concepts of data analytics in finance, business reports on economic fluctuations, financial forecasts, and presentations on market activities.
Powered by 


2
downloads
downloads
Tags:
More
Credit Photo
If you would like to credit the Photo, here are some ways you can do so
Text Link
photo Link
<span class="text-link">
<span>
<a target="_blank" href=https://pikwizard.com/photo/red-line-graph-over-histogram-representing-financial-volatility/19b38f2eb544502394d64b476a4d3d45/>PikWizard</a>
</span>
</span>
<span class="image-link">
<span
style="margin: 0 0 20px 0; display: inline-block; vertical-align: middle; width: 100%;"
>
<a
target="_blank"
href="https://pikwizard.com/photo/red-line-graph-over-histogram-representing-financial-volatility/19b38f2eb544502394d64b476a4d3d45/"
style="text-decoration: none; font-size: 10px; margin: 0;"
>
<img src="https://pikwizard.com/pw/medium/19b38f2eb544502394d64b476a4d3d45.jpg" style="margin: 0; width: 100%;" alt="" />
<p style="font-size: 12px; margin: 0;">PikWizard</p>
</a>
</span>
</span>
Free (free of charge)
Free for personal and commercial use.
Author: Creative Art
Similar Free Stock Images

Premium


Premium


Premium


Premium


Premium


Premium


Premium


Premium


Premium


Premium


Premium


Premium


Premium


Premium


Premium


Premium


Premium


Premium


Premium


Premium


Premium


Premium


Premium


Premium

