- Home >
- Stock Photos >
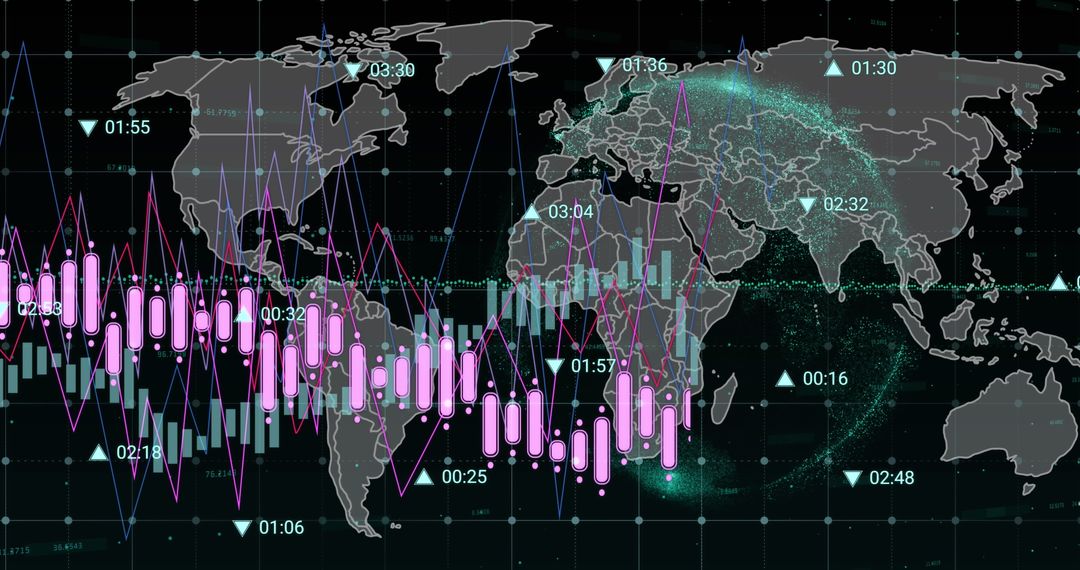
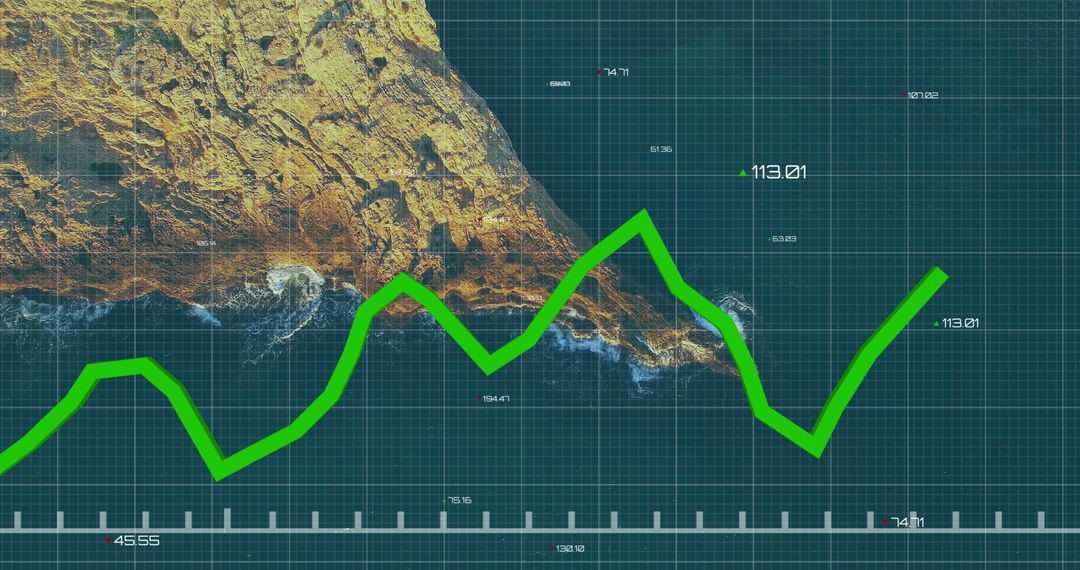
- Rising Data and Statistics on Global Map in Green Interface Design
Rising Data and Statistics on Global Map in Green Interface Design Image

This visualization shows data trends over a world map in a green high-tech color scheme, suggesting global business or financial growth. Useful for financial presentations, technology content, economic analysis reports, and strategic planning visuals highlighting global market dynamics.
Powered by 


0
downloads
downloads
Tags:
More
Credit Photo
If you would like to credit the Photo, here are some ways you can do so
Text Link
photo Link
<span class="text-link">
<span>
<a target="_blank" href=https://pikwizard.com/photo/rising-data-and-statistics-on-global-map-in-green-interface-design/e4913f3d561fc16dae9918042c706d13/>PikWizard</a>
</span>
</span>
<span class="image-link">
<span
style="margin: 0 0 20px 0; display: inline-block; vertical-align: middle; width: 100%;"
>
<a
target="_blank"
href="https://pikwizard.com/photo/rising-data-and-statistics-on-global-map-in-green-interface-design/e4913f3d561fc16dae9918042c706d13/"
style="text-decoration: none; font-size: 10px; margin: 0;"
>
<img src="https://pikwizard.com/pw/medium/e4913f3d561fc16dae9918042c706d13.jpg" style="margin: 0; width: 100%;" alt="" />
<p style="font-size: 12px; margin: 0;">PikWizard</p>
</a>
</span>
</span>
Free (free of charge)
Free for personal and commercial use.
Author: Awesome Content
Similar Free Stock Images

Premium


Premium


Premium


Premium


Premium


Premium


Premium


Premium


Premium


Premium


Premium


Premium


Premium


Premium


Premium


Premium


Premium


Premium


Premium


Premium


Premium


Premium


Premium


Premium