
- Home >
- Stock Photos >
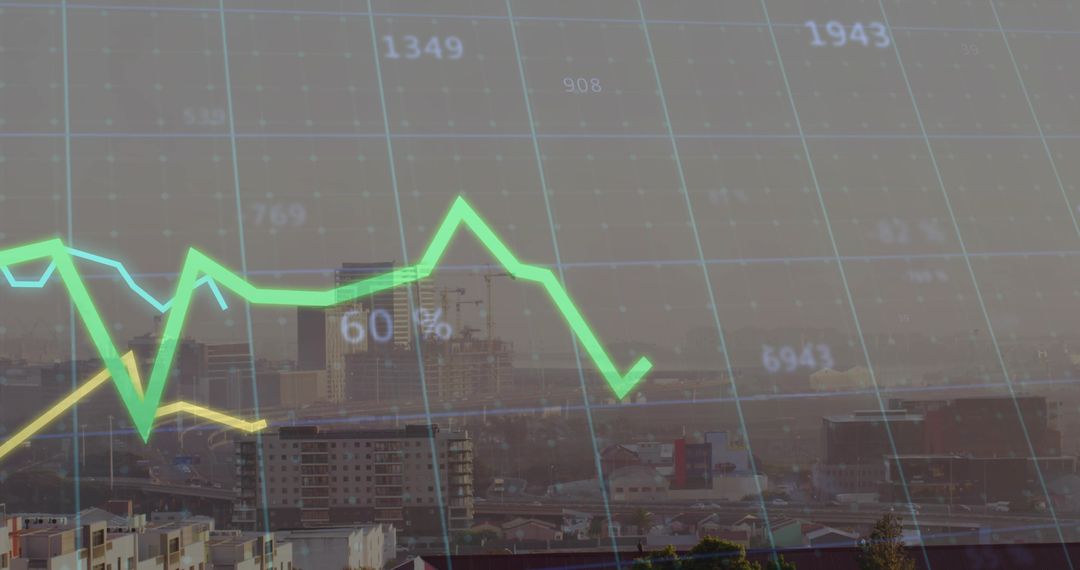
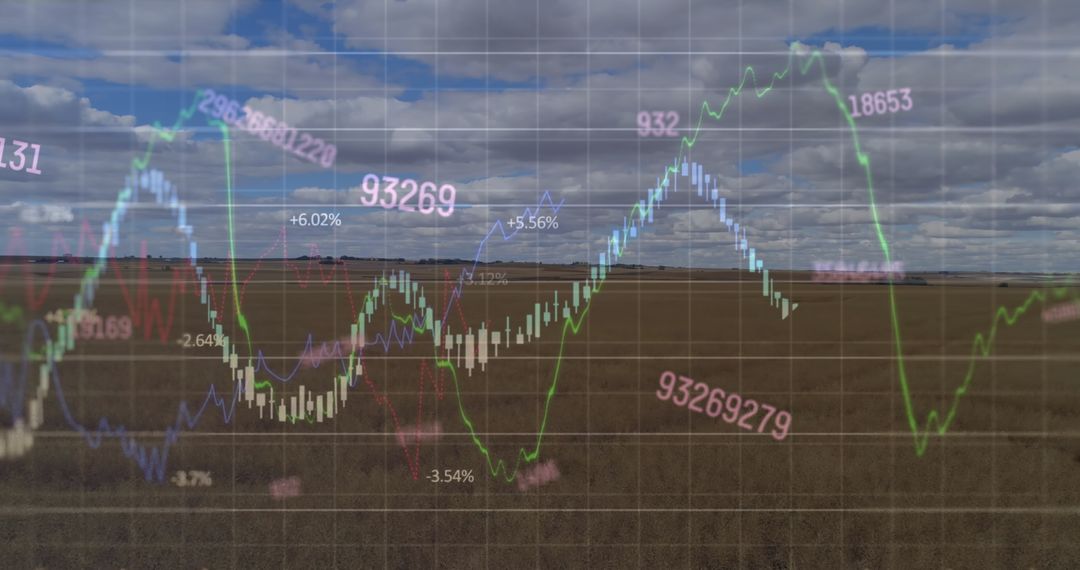
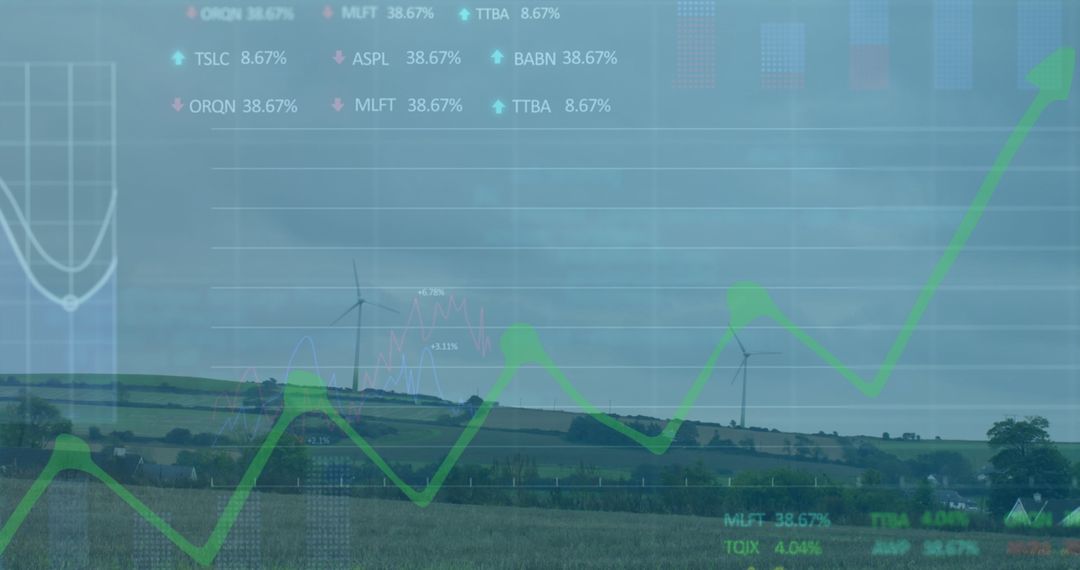
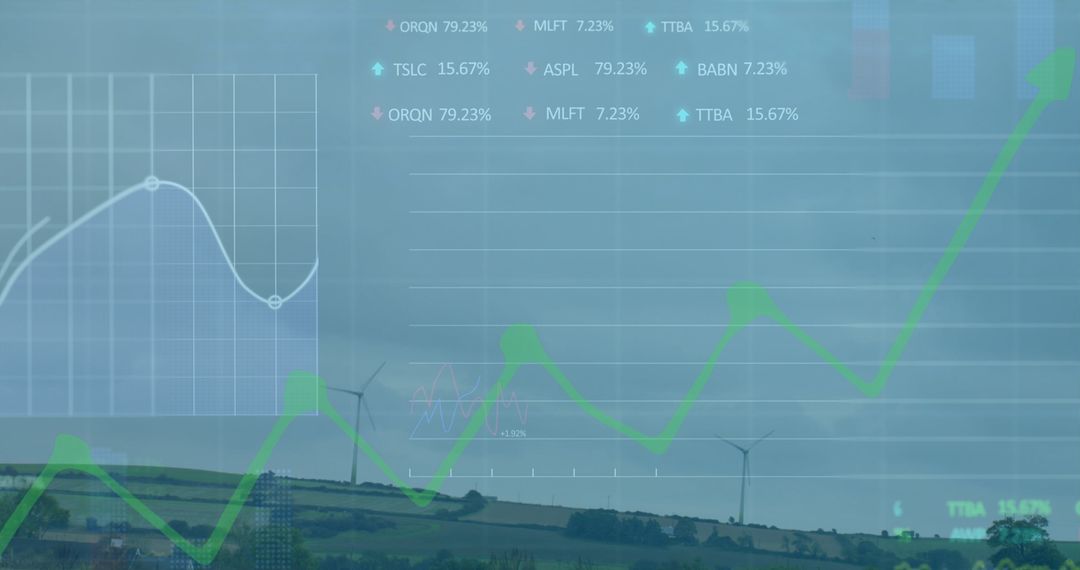
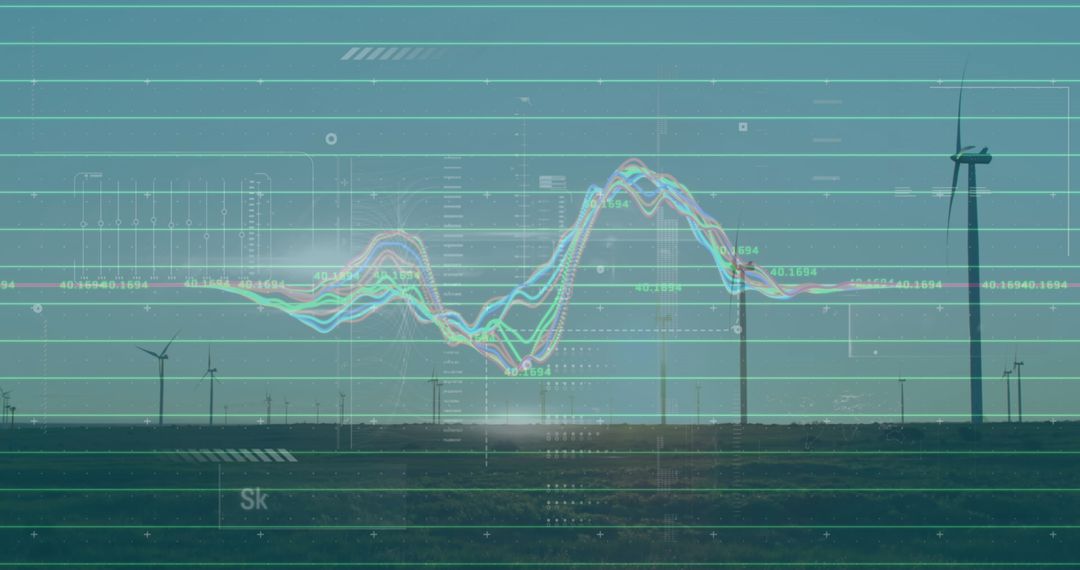
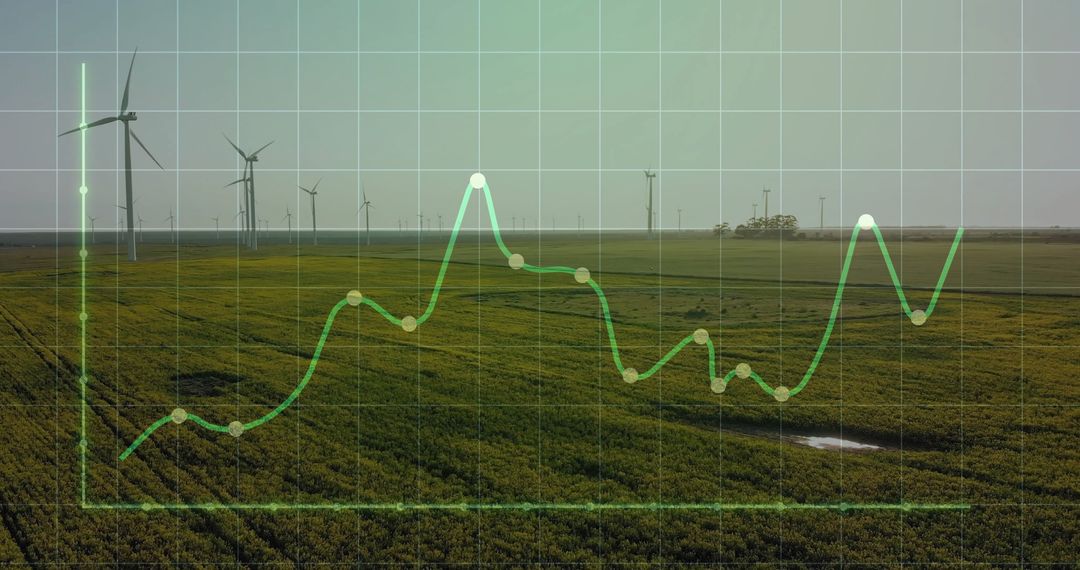
- Rising Data Trend Over Conceptual Field and Sky
Rising Data Trend Over Conceptual Field and Sky Image
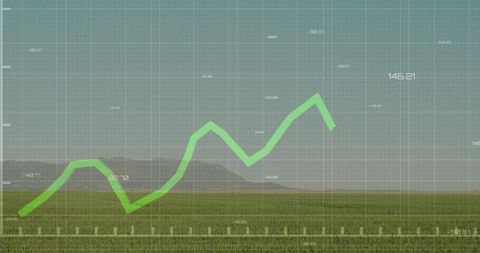
Graph reflects fluctuating trends or profit growth set against serene countryside landscape, portraying innovation juxtaposed with nature. Valuable for illustrating statistics concepts, financial analysis, business projects focusing on environmental impact combined with data advancement. Suitable for presentations, articles about finance, sustainability or rural development insights intersecting with modern technology.
Powered by  - Get 15% off with code: PIKWIZARD15


0
downloads
downloads
Tags:
More
Credit Photo
If you would like to credit the Photo, here are some ways you can do so
Text Link
photo Link
<span class="text-link">
<span>
<a target="_blank" href=https://pikwizard.com/photo/rising-data-trend-over-conceptual-field-and-sky/553c4d35ef2a658dfb3b0991b91b5fba/>PikWizard</a>
</span>
</span>
<span class="image-link">
<span
style="margin: 0 0 20px 0; display: inline-block; vertical-align: middle; width: 100%;"
>
<a
target="_blank"
href="https://pikwizard.com/photo/rising-data-trend-over-conceptual-field-and-sky/553c4d35ef2a658dfb3b0991b91b5fba/"
style="text-decoration: none; font-size: 10px; margin: 0;"
>
<img src="https://pikwizard.com/pw/medium/553c4d35ef2a658dfb3b0991b91b5fba.jpg" style="margin: 0; width: 100%;" alt="" />
<p style="font-size: 12px; margin: 0;">PikWizard</p>
</a>
</span>
</span>
Free (free of charge)
Free for personal and commercial use.
Author: Authentic Images
Similar Free Stock Images

Premium


Premium


Premium


Premium


Premium


Premium


Premium


Premium


Premium


Premium


Premium


Premium


Premium


Premium


Premium


Premium


Premium


Premium


Premium


Premium


Premium


Premium


Premium


Premium

