- Home >
- Stock Photos >
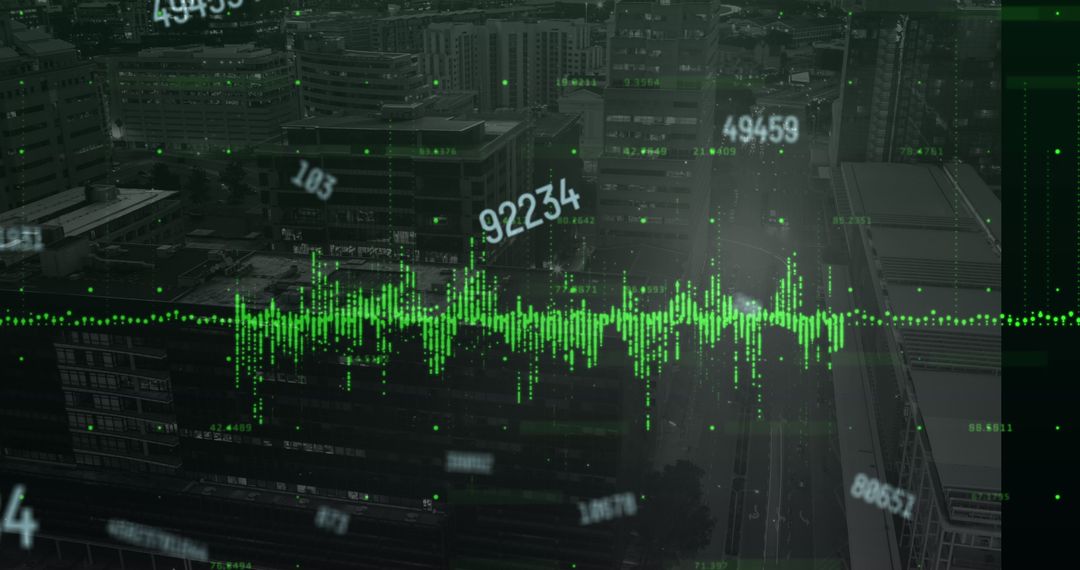
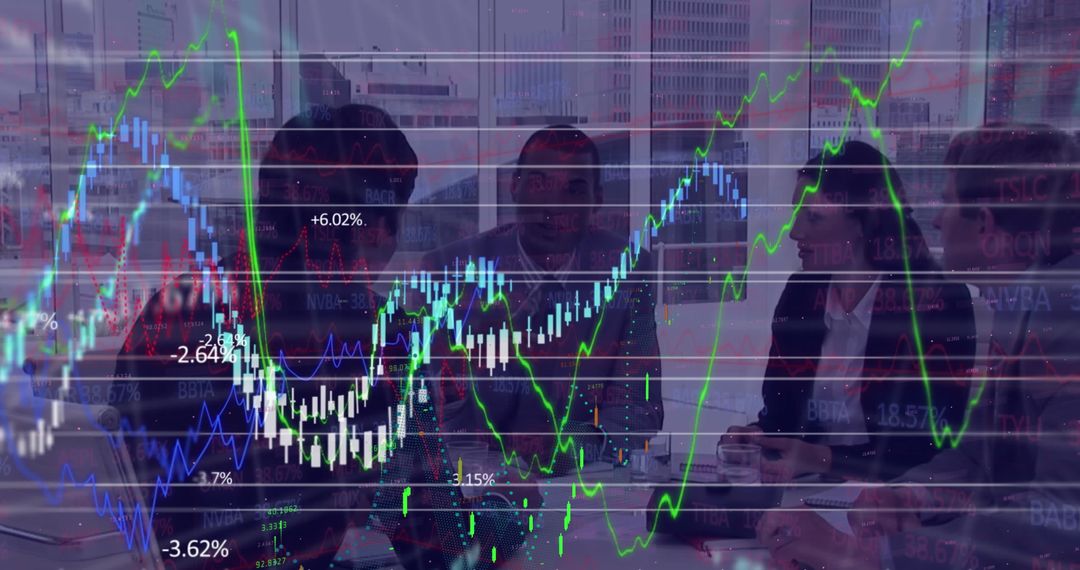
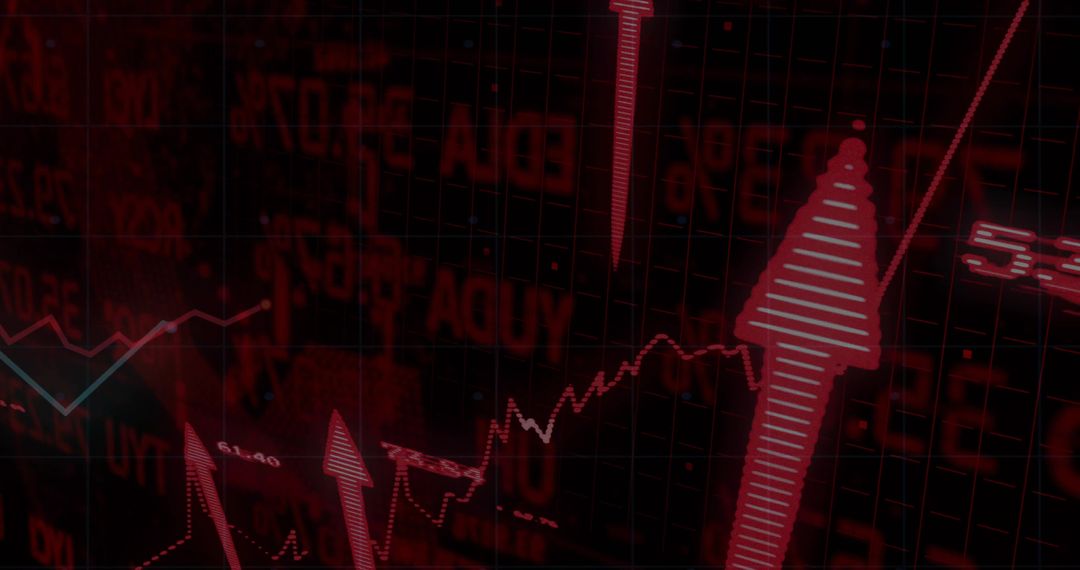
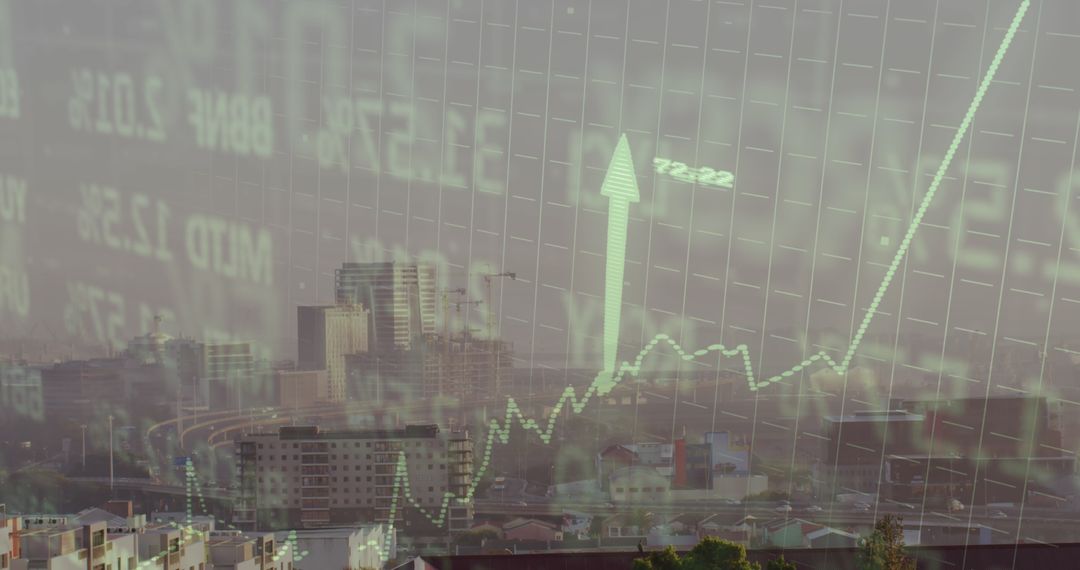
- Rising stock market graph with glowing upward arrows and numeric callouts over cityscape
Rising stock market graph with glowing upward arrows and numeric callouts over cityscape Image

Dynamic composition showing rising dotted stock chart, glowing upward arrows, numeric callouts over blurred urban skyline. Perfect for illustrating market growth, bullish momentum, financial analytics, investment performance. Use for website hero banners, financial report covers, blog headers, investor presentations, pitch decks, fintech app backgrounds, trading platform landing pages, social media ads, newsletter visuals. Color palette and motion blur creating dramatic tech-focused mood, suitable for technology, finance, data-driven marketing. High contrast and bold arrows drawing attention to upward movement, leaving space for overlaying text or logos.
Powered by 


0
downloads
downloads
Tags:
More
Credit Photo
If you would like to credit the Photo, here are some ways you can do so
Text Link
photo Link
<span class="text-link">
<span>
<a target="_blank" href=https://pikwizard.com/photo/rising-stock-market-graph-with-glowing-upward-arrows-and-numeric-callouts-over-cityscape/bdd26595e28e3eb5070a04ae6c6e790f/>PikWizard</a>
</span>
</span>
<span class="image-link">
<span
style="margin: 0 0 20px 0; display: inline-block; vertical-align: middle; width: 100%;"
>
<a
target="_blank"
href="https://pikwizard.com/photo/rising-stock-market-graph-with-glowing-upward-arrows-and-numeric-callouts-over-cityscape/bdd26595e28e3eb5070a04ae6c6e790f/"
style="text-decoration: none; font-size: 10px; margin: 0;"
>
<img src="https://pikwizard.com/pw/medium/bdd26595e28e3eb5070a04ae6c6e790f.jpg" style="margin: 0; width: 100%;" alt="" />
<p style="font-size: 12px; margin: 0;">PikWizard</p>
</a>
</span>
</span>
Free (free of charge)
Free for personal and commercial use.
Author: People Creations
Similar Free Stock Images

Premium


Premium


Premium


Premium


Premium


Premium


Premium


Premium


Premium


Premium


Premium


Premium


Premium


Premium


Premium


Premium


Premium


Premium


Premium


Premium


Premium


Premium


Premium


Premium