- Home >
- Stock Photos >
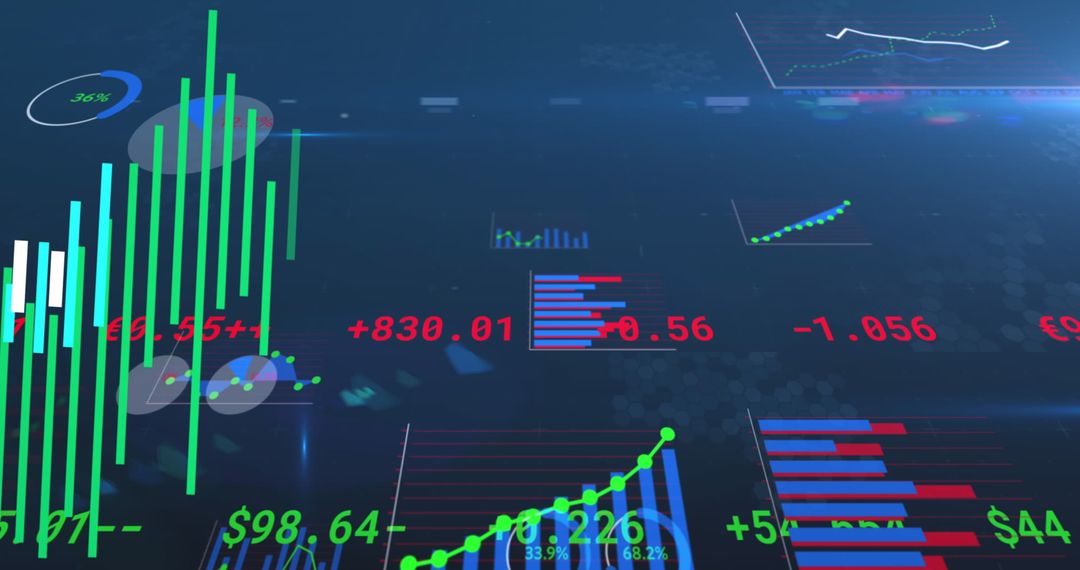
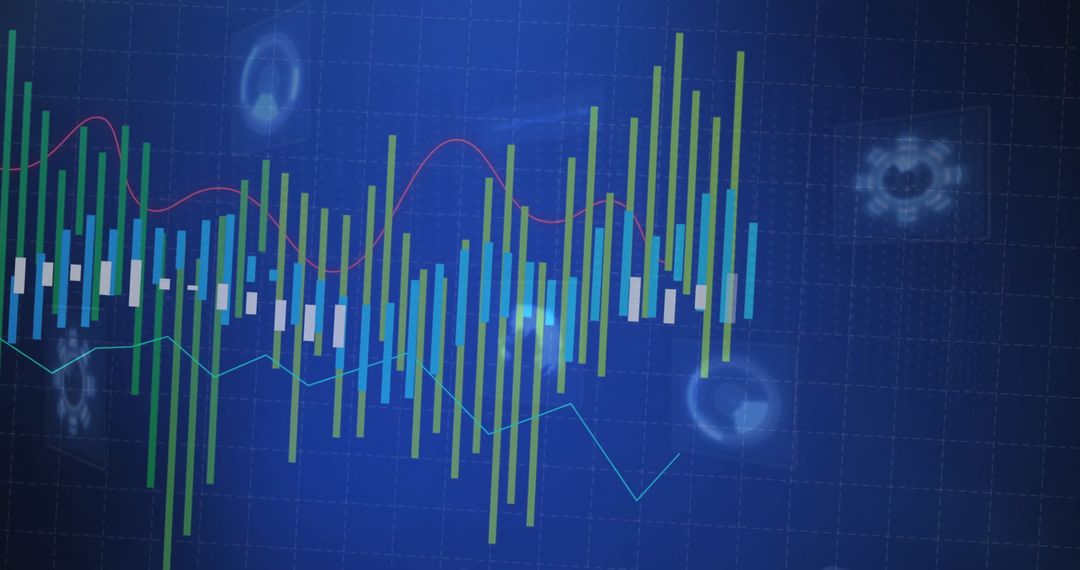
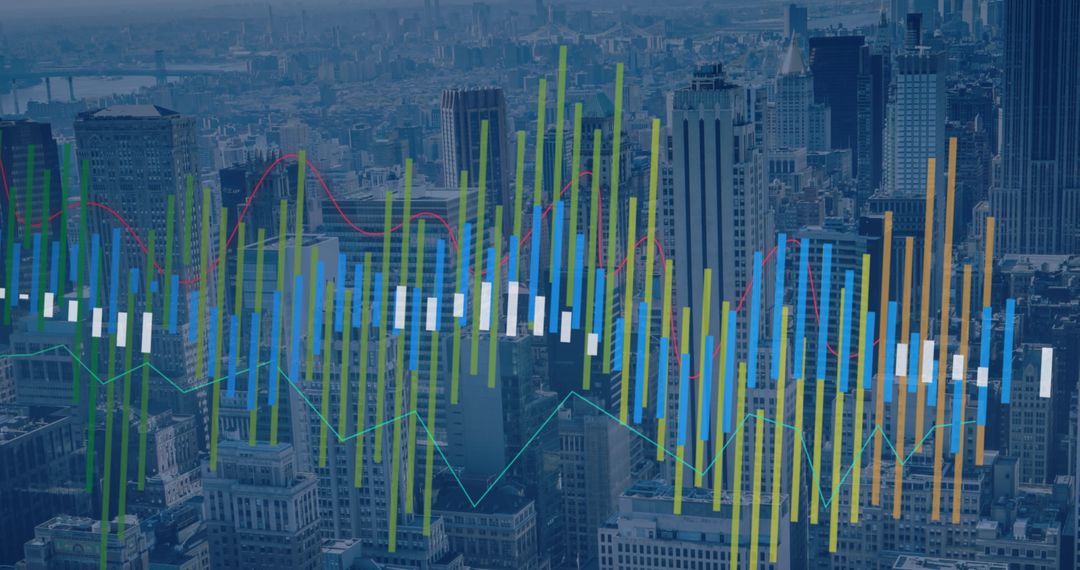
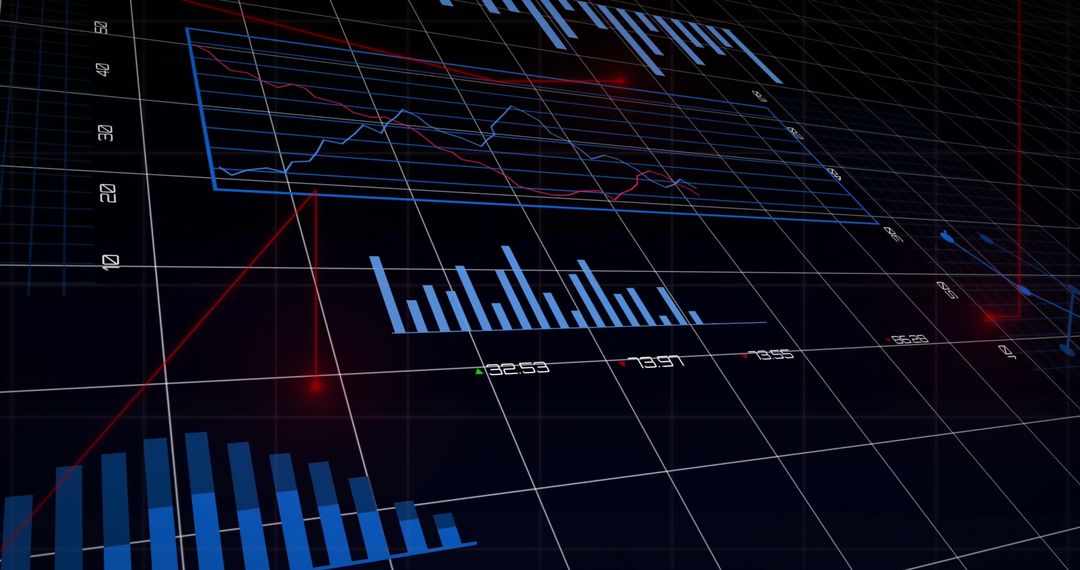
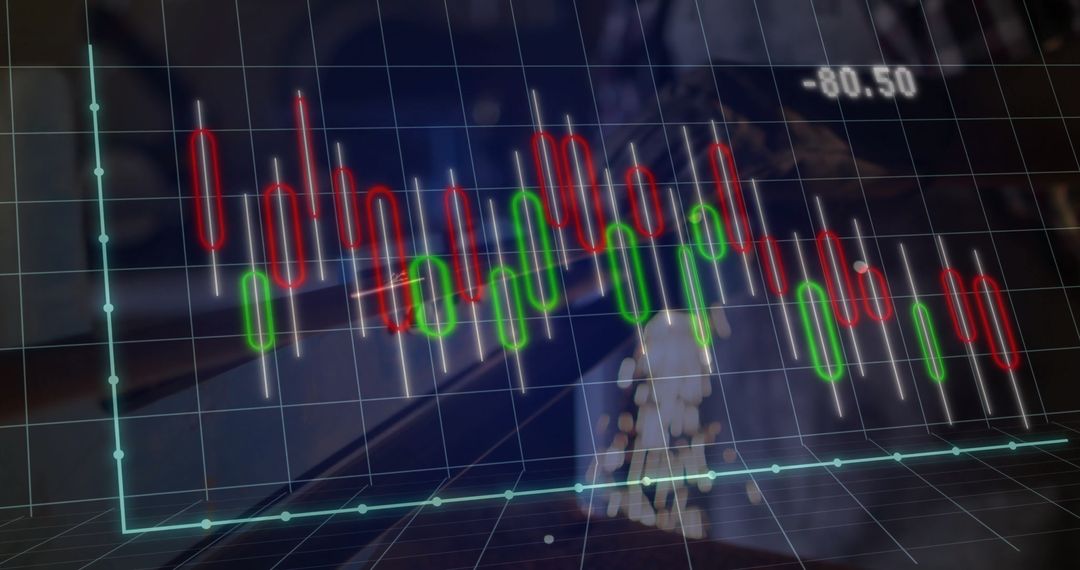
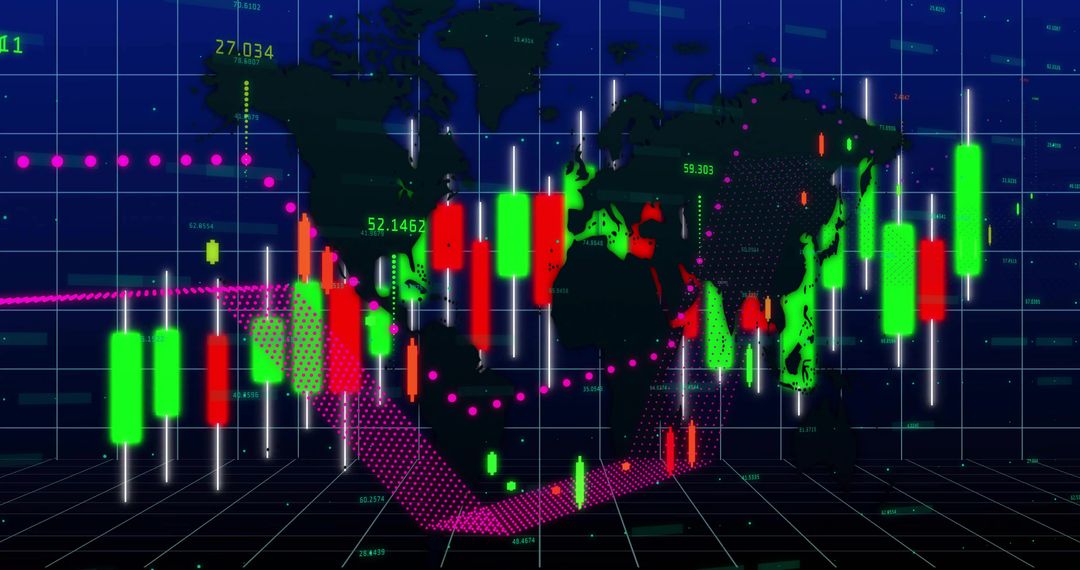
- Shopping Cart Analytics with Dynamic Charting Visuals
Shopping Cart Analytics with Dynamic Charting Visuals Image

Highlighting the intersection of technology and finance, this visual creatively combines a digital shopping cart and a dynamic analytics chart over a circuit board background. It signifies modern technology trends, data-driven decision making and smart investments. Useful for illustrating the future of e-commerce, financial forecasting, and innovative data solutions in presentations, articles, and marketing materials targeting technology enthusiasts and financial experts.
Powered by  - Get 15% off with code: PIKWIZARD15


0
downloads
downloads
Tags:
More
Credit Photo
If you would like to credit the Photo, here are some ways you can do so
Text Link
photo Link
<span class="text-link">
<span>
<a target="_blank" href=https://pikwizard.com/photo/shopping-cart-analytics-with-dynamic-charting-visuals/f8c21a946d07211a47ab42a2a9f1a887/>PikWizard</a>
</span>
</span>
<span class="image-link">
<span
style="margin: 0 0 20px 0; display: inline-block; vertical-align: middle; width: 100%;"
>
<a
target="_blank"
href="https://pikwizard.com/photo/shopping-cart-analytics-with-dynamic-charting-visuals/f8c21a946d07211a47ab42a2a9f1a887/"
style="text-decoration: none; font-size: 10px; margin: 0;"
>
<img src="https://pikwizard.com/pw/medium/f8c21a946d07211a47ab42a2a9f1a887.jpg" style="margin: 0; width: 100%;" alt="" />
<p style="font-size: 12px; margin: 0;">PikWizard</p>
</a>
</span>
</span>
Free (free of charge)
Free for personal and commercial use.
Author: People Creations
Similar Free Stock Images

Premium


Premium


Premium


Premium


Premium


Premium


Premium


Premium


Premium


Premium


Premium


Premium


Premium


Premium


Premium


Premium


Premium


Premium


Premium


Premium


Premium


Premium


Premium


Premium