- Home >
- Stock Photos >
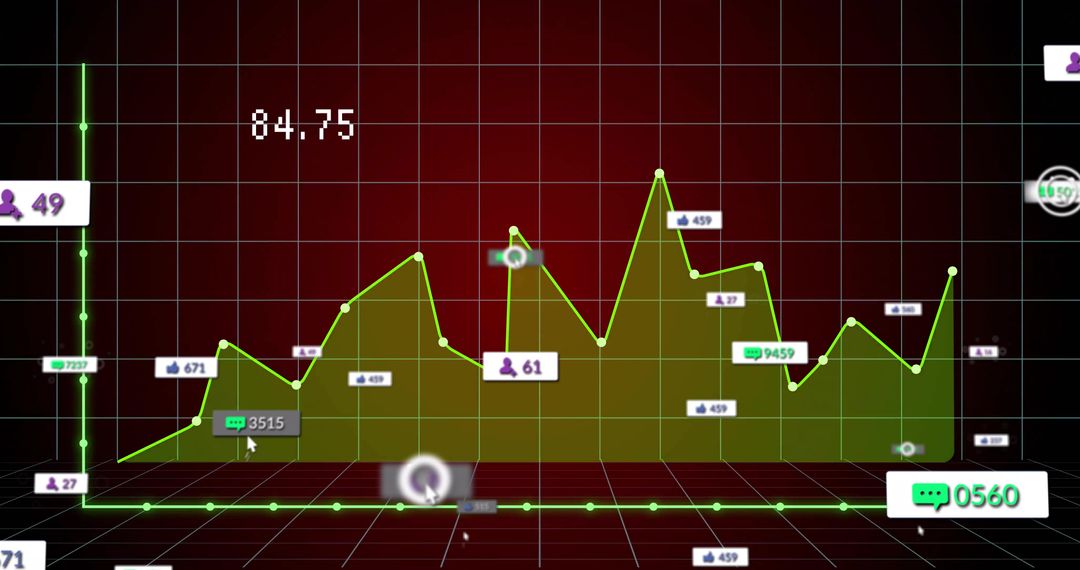
- Social Media and Stock Data Integration with Digital Graphics
Social Media and Stock Data Integration with Digital Graphics Image

Visualizes integration of social media engagement icons with financial data, illustrating connections between global social activities and stock market trends. Useful for presentations on social media impact on economy, financial data interpretation, and digital connectivity.
Powered by 


2
downloads
downloads
Tags:
More
Credit Photo
If you would like to credit the Photo, here are some ways you can do so
Text Link
photo Link
<span class="text-link">
<span>
<a target="_blank" href=https://pikwizard.com/photo/social-media-and-stock-data-integration-with-digital-graphics/5a10dc7a72696d27a053dfaeb14d0ebc/>PikWizard</a>
</span>
</span>
<span class="image-link">
<span
style="margin: 0 0 20px 0; display: inline-block; vertical-align: middle; width: 100%;"
>
<a
target="_blank"
href="https://pikwizard.com/photo/social-media-and-stock-data-integration-with-digital-graphics/5a10dc7a72696d27a053dfaeb14d0ebc/"
style="text-decoration: none; font-size: 10px; margin: 0;"
>
<img src="https://pikwizard.com/pw/medium/5a10dc7a72696d27a053dfaeb14d0ebc.jpg" style="margin: 0; width: 100%;" alt="" />
<p style="font-size: 12px; margin: 0;">PikWizard</p>
</a>
</span>
</span>
Free (free of charge)
Free for personal and commercial use.
Author: Creative Art
Similar Free Stock Images

Premium


Premium


Premium


Premium


Premium


Premium


Premium


Premium


Premium


Premium


Premium


Premium


Premium


Premium


Premium


Premium


Premium


Premium


Premium


Premium


Premium


Premium


Premium


Premium