- Home >
- Stock Photos >
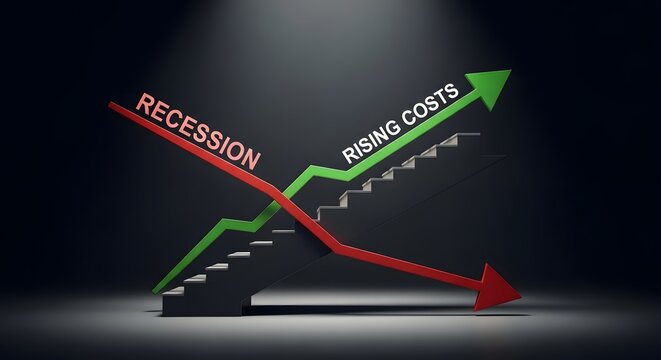
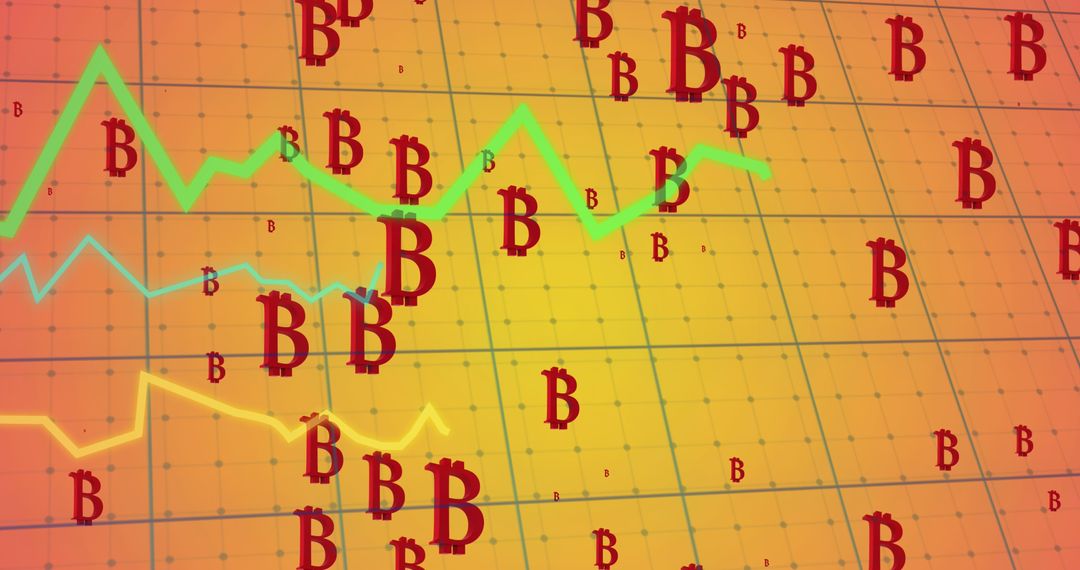
- Stagflation Concept Over Financial Charts with Digital Interface
Stagflation Concept Over Financial Charts with Digital Interface Image

Image depicting stagflation against digital charts highlights the challenges of the global economy. Useful for articles on financial uncertainty, economic analysis, and academic discussions about inflationary impacts.
Powered by 


2
downloads
downloads
Tags:
More
Credit Photo
If you would like to credit the Photo, here are some ways you can do so
Text Link
photo Link
<span class="text-link">
<span>
<a target="_blank" href=https://pikwizard.com/photo/stagflation-concept-over-financial-charts-with-digital-interface/6aa872392235a7503f7c5c936309143b/>PikWizard</a>
</span>
</span>
<span class="image-link">
<span
style="margin: 0 0 20px 0; display: inline-block; vertical-align: middle; width: 100%;"
>
<a
target="_blank"
href="https://pikwizard.com/photo/stagflation-concept-over-financial-charts-with-digital-interface/6aa872392235a7503f7c5c936309143b/"
style="text-decoration: none; font-size: 10px; margin: 0;"
>
<img src="https://pikwizard.com/pw/medium/6aa872392235a7503f7c5c936309143b.jpg" style="margin: 0; width: 100%;" alt="" />
<p style="font-size: 12px; margin: 0;">PikWizard</p>
</a>
</span>
</span>
Free (free of charge)
Free for personal and commercial use.
Author: Creative Art
Similar Free Stock Images
Premium


Premium


Premium


Premium


Premium


Premium


Premium


Premium


Premium


Premium


Premium


Premium


Premium


Premium


Premium


Premium


Premium


Premium


Premium


Premium


Premium


Premium


Premium


Premium