1. Home > 
  2. Stock Photos > 
  3. Statistical Data on Orange Gradient Background

Statistical Data on Orange Gradient Background Image

Statistical Data on Orange Gradient Background

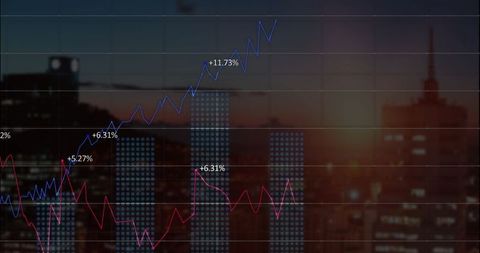
Visual representation of statistical data processing and grid structure creates a sense of digital analysis and business insight. Ideal for illustrating concepts in financial reports, business presentations, or technology updates. Useful for demonstrating investment strategies, stock trends, or growth analytics.

Powered by Adobe logo
High-tech global network connection interface showing worldwide digital communication, data exchange, and internet connectivity. Global connection, data interaction, and worldwide communication. Thunk - Powered by AdobeAbstract Financial Data Visualization with Red Stock Market Chart and Blue Digital Background for Business Analysis and Economic Forecasting - Powered by AdobeIlluminated VAT Report text on a glowing blue digital landscape, portraying the financial analysis and business monitoring. ..Created with Generative AI, not depicting real subjects. - Powered by AdobeFuturistic glowing abstract, featuring rising bar graphs with an animated data line - Powered by AdobeAn abstract representation of data flow with glowing lines and swirling patterns in a dark field - Powered by Adobe

Credit Photo

If you would like to credit the Photo, here are some ways you can do so

Free (free of charge)

Free for personal and commercial use.

Author: Awesome Content

Similar Free Stock Images

Digital Graphs Displaying Financial Data Analysis in Blue
Premium
Futuristic digital interface displaying global data analysis, with a central world globe.
Financial Data Visualization in Modern Digital Display Office
Digital Data Processing Graph Interface with Progress Bar
Dynamic Financial Charts with Blue Digital Interface
Colorful Financial Data Display on Digital Screen for Trading and Analytics
Premium
Abstract digital financial data visualization with glowing blue and purple stock market charts and graphs on a dark grid background representing economic growth and investment trends
Digital Financial Data Chart and Analytics Interface
Financial Data Analysis Graph with Growing Trends
Data Analytics and Stock Market Graphs
Financial Growth Graph and Data Analytics Representation
Premium
Digital Financial Growth Chart Showing Upward Trend with Glowing Ascending Arrow and Data Points
Digital Financial Graph Illustrating Stock Market Trends
Dynamic Financial Graphs on Digital Screen Displaying Market Trends
Financial Data with Trend Lines and Bar Charts
Finance and Technology Theme with Stock Market Data Overlay
Premium
Wireframe hand holding magnifying glass over glowing stock market chart graph finance
Digital Soundwaves with Data Graphs and Coding Elements
Digital Financial Data Analysis and Stock Market Charting
Financial Data Processing Over Digital Grid
Abstract Financial Data Visualization with Graphs and Grid Background
Premium
Stunning futuristic data visualization with glowing digital bar charts representing growth and analytics on a dark grid background
Digital Financial Graphs and Business Analytics on Blue Backdrop
Financial Data Analytics Over Digital Grid Screen
Digital Data Processing Chart and Interface on Pink Background
Data Analytics and Technology on Orange Background
Premium
Digital mountain graph with a glowing flag at the summit and a blue grid background chart data
Dynamic Financial Graph with Data Analysis Conceptual Background
Financial Trends Analytics Over Cityscape at Dusk
Financial Charts with Blue and Red Lines and Digital Percent Indicators
Stock Market Analysis Dashboard with Positive and Negative Trends
Colorful Stock Market Display with Graphs and Tickers on Blue Background
Financial Data Graphs Over Cityscape Indicating Global Business Concept
Premium
Abstract financial data visualization, showcasing an upward trend with green bars on a dark background
Financial Data Analytics on Digital Interface Displaying Graphs
Dynamic Financial Data and Graphs on Digital Interface
Dynamic Financial Stock Market Data Chart Visualization
Rising Graph with Data and Analysis Objects on Blue Background
Premium
Abstract digital data visualization with glowing lines, bars, and points on a dark grid
Rising Graphs and Interactive Financial Data Analytics Background
Rising Financial Graph on Purple Background
Global Financial Trends and Digital Data Visualization Concepts
Digital Visualization Financial Data Growth Progressive Graph
Premium
Digital representation of data with vibrant blue and orange wave patterns, creating a futuristic and technological visualization
Analyzing Business Growth with Architectural Backdrop
Abstract Digital Stock Market Interface with Graphs and Data
Futuristic Data Chart with Digital Interface Elements
Dynamic Stock Market Analysis on Digital Screen
Premium
Futuristic digital network interface displaying data analytics for business communication
Global Financial Data Processing with Digital Interface Elements
Stock Market Graph with Social Media Notifications Overlay
3D Financial Data Imagery with Graphs and Charts on White
Financial Data Analysis with Dynamic Growth Charts
Premium
Digital data analyzing financial market statistics connecting network
Financial Stock Market Trends Over Digital Grid Background
Data Visualization with Diagrams on Green Gradient
Dynamic Financial Data Growth Chart Display
Financial Data Graphic with Rising Trends on Digital Grid
Premium
Abstract digital data representation with glowing orange cubes and a fluctuating line graph
Financial Analytics Dashboard with Growth Trends and Indicators
Digital Analytics Graph with Futuristic 3D Interface
Holographic financial analytics dashboard displaying neon code with rising line charts
Abstract Financial Data with Rising Line Graphs in Orange
Digital Financial Data and Dynamic Stock Market Graphs
AI Face Identification with Digital Data Integration
Premium
Futuristic data visualization skyline with glowing blue bar charts and line graph
Financial Data Display in Digital Grid Design
Abstract Financial Graph Display on Dark Background
Trending Financial Graphs with Red and Blue Analytics Lines
Data Processing and Cloud Computing Server Room Visualization
Premium
Abstract data visualization with rising bars and glowing particles on a dark textured surface
Digital Analysis of Financial Data with Dynamic Graphs
Statistical Data and Trends Over Digital Grid Overlay
Abstract Financial Data Chart with Positive Trends and Percentages
Digital Interface with Data Analytics and Processing Visuals
Premium
Glowing waveform art in shades of green and gold; digital rendering depicting data trends
Financial Data Analysis with Graphical Digital Interface
Statistical Data Display Over Grid Network With Orange Gradient
Dynamic Financial Graphs with Holographic Elements on Orange Background
Transforming Data and Financial Analysis on Pink Graph
Premium
Illuminated display presents various data visualizations with colorful graphs, charts, and a circular pie chart, showcasing complex information in a grid arrangement with a dark background,
Futuristic Data Analysis and Statistical Interface Visualization
Global Financial Data Analysis on Grid Background
Dynamic Display of Financial Market Data on Advanced Grid
Digital Data Analytics Growth Trend with Graphs
Premium
A collection of six different black and white data and chart related line art icons in a grid layout created with generated ai
Dynamic Financial Data Chart on Green Gradient Background
Abstract Business Technology Data Presentation
Financial Data Charts with Viewing Grid in Dark Perspective
Digital Graph and Data Analysis with Financial Growth Trends
Premium
A glowing arrow pointing upwards on a blue grid background representing growth and success trend
Digital Dashboard Displaying Financial Chart and Analytics Interface
Displaying digital trading dashboard visualizing realtime market data and candlestick charts
Digital Financial Data Stream with Numeric Overlay
Ukraine Crisis Financial Graphs Overlay
Digital Data Processing and Encryption Interface Concept
Digital Financial Data Overlaid on Urban Cityscape at Dusk
Premium
Abstract futuristic digital data visualization with glowing geometric shapes and bars on a grid surface
Abstract Graph Display with Dynamic Business Growth Indicators
Financial Data Visualization on Digital Grid
Dynamic Financial Data Charts on Dark Digital Background
Digital Financial Data Display Tracking Market Trends
Premium
Growth Tree Graph Futuristic Business Investment Illustration
Dynamic Lines Show Rising Financial Statistics Over Time
Colorful Data Analytics Bar Graphs on Digital Screen
Data Analytics with Dynamic Global Market Trends on Screen
Abstract Graphic Business Data Visualization
Premium
Neon Growth Chart with Arrow and Columns on Grid, Futuristic Business Concept
Volatile Stock Market Data on Display
Soundwave Visualization and Data Analysis on Digital Grid
Global Data and Financial Trends with Digital Interface
Dynamic Stock Market Graph with Percentage Indicators
Premium
Abstract financial market chart with glowing data lines overlaid on a grid set against a blurred twilight cityscape with bokeh lights
Dynamic Financial Data with Global Connections and Insights
Data Processing Overlaid on Graphs and Code in Digital Interface
Digital Display of Financial Data with Graph and Figures
Abstract Financial Chart with Rising and Falling Indicators
Premium
Digital glowing zigzag line chart over blue abstract data grid background illustrating financial or technological growth and analysis
Digital Financial Data Analysis on Abstract Blue Background
Abstract Digital Financial Data Graph Chart
Futuristic Data Visualization with Dynamic Graphs
Modern Multi-Colored Financial Graphs on Digital Dashboard
Premium
Abstract glass bar charts reflecting on a digital surface, illustrating global business statistics, financial growth, and technological advancements in data analytics
Subscriber Analytics Dashboard with Candlestick Charts and Line Graphs Showing 477,785 Subscribers