- Home >
- Stock Photos >
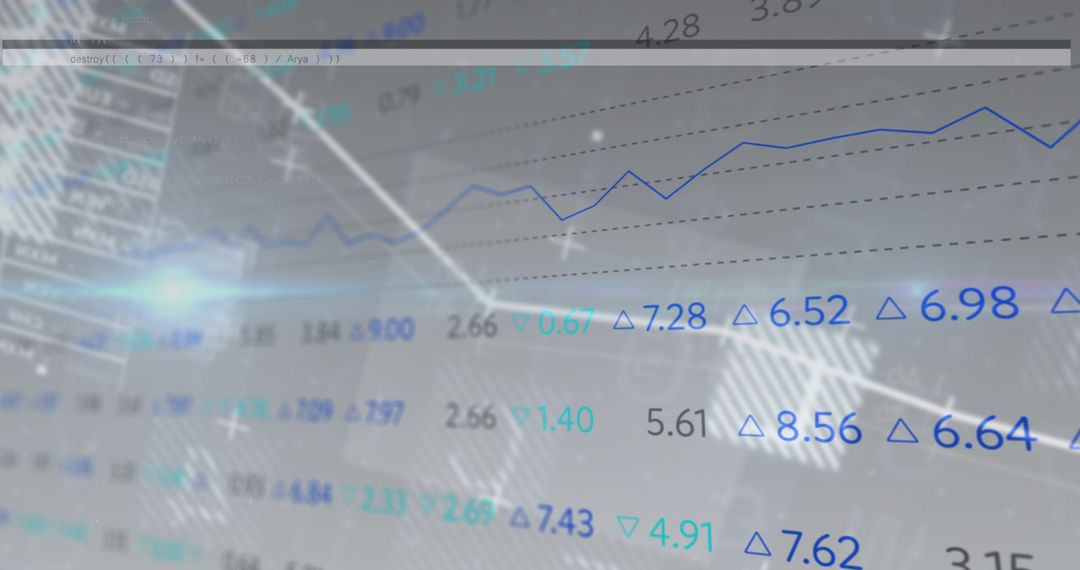
- Stock Market Analysis with Charts and Graphs Indicating Trends
Stock Market Analysis with Charts and Graphs Indicating Trends Image

Visual depiction of stock market data with dynamic charts and graphs conveying financial trends and analytical insights. Useful for finance professionals, investors or anyone involved in economic studies needing a comprehensive graphic to illustrate stock analysis or trading strategies.
Powered by 


2
downloads
downloads
Tags:
More
Credit Photo
If you would like to credit the Photo, here are some ways you can do so
Text Link
photo Link
<span class="text-link">
<span>
<a target="_blank" href=https://pikwizard.com/photo/stock-market-analysis-with-charts-and-graphs-indicating-trends/809aabb9754edae49df4c6a9be7c6ab1/>PikWizard</a>
</span>
</span>
<span class="image-link">
<span
style="margin: 0 0 20px 0; display: inline-block; vertical-align: middle; width: 100%;"
>
<a
target="_blank"
href="https://pikwizard.com/photo/stock-market-analysis-with-charts-and-graphs-indicating-trends/809aabb9754edae49df4c6a9be7c6ab1/"
style="text-decoration: none; font-size: 10px; margin: 0;"
>
<img src="https://pikwizard.com/pw/medium/809aabb9754edae49df4c6a9be7c6ab1.jpg" style="margin: 0; width: 100%;" alt="" />
<p style="font-size: 12px; margin: 0;">PikWizard</p>
</a>
</span>
</span>
Free (free of charge)
Free for personal and commercial use.
Author: People Creations
Similar Free Stock Images

Premium


Premium


Premium


Premium


Premium


Premium


Premium


Premium


Premium


Premium


Premium


Premium


Premium


Premium


Premium


Premium


Premium


Premium


Premium


Premium


Premium


Premium


Premium


Premium