- Home >
- Stock Photos >
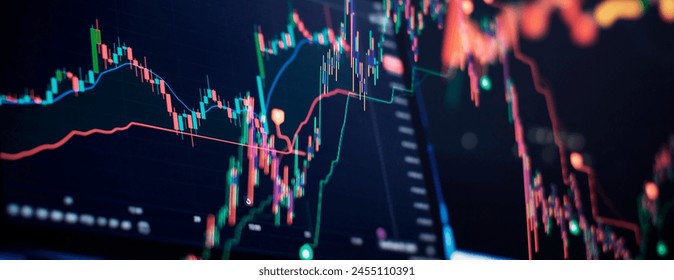
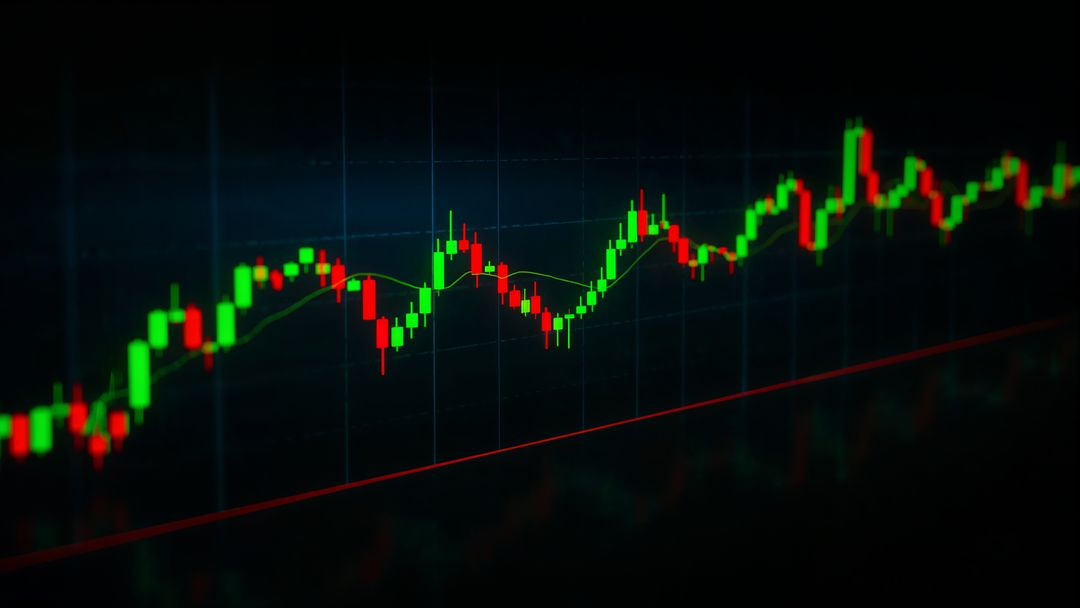
- Stock Market Candlestick Chart Trading Analysis Display
Stock Market Candlestick Chart Trading Analysis Display Image

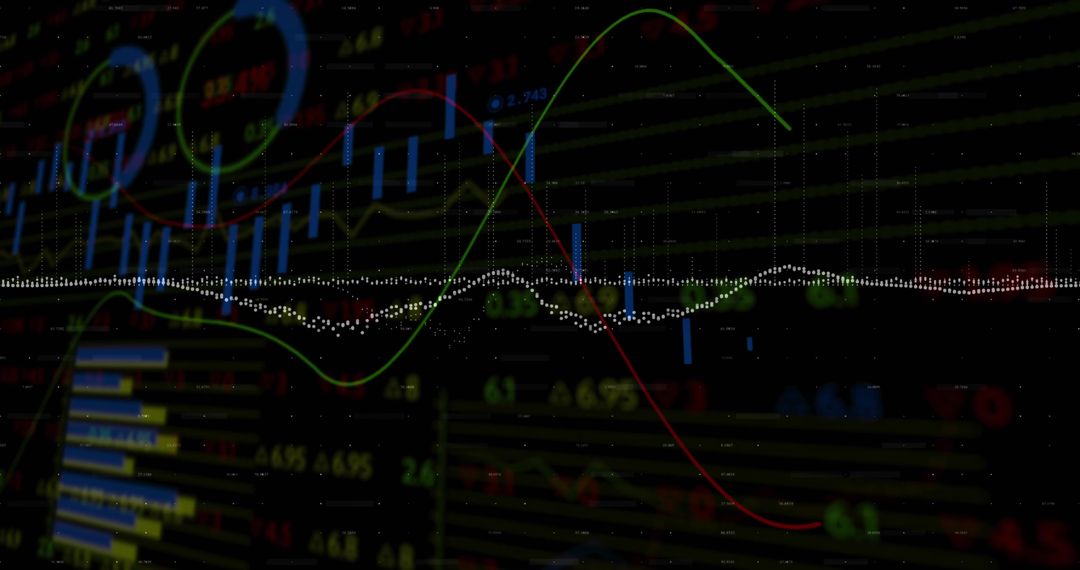
AI Generated Image. This digital depiction of a candlestick chart is ideal for illustrating financial articles, blog posts, or educational content related to investment and stock market analysis. The focus on green and red bars effectively communicates market trends and fluctuations, appealing to finance professionals or enthusiasts. Great for presentations on digital trading environments and applications involving market data visualization.
Powered by  - Get 15% off with code: PIKWIZARD15


0
downloads
downloads
Tags:
More
Credit Photo
If you would like to credit the Photo, here are some ways you can do so
Text Link
photo Link
<span class="text-link">
<span>
<a target="_blank" href=https://pikwizard.com/photo/stock-market-candlestick-chart-trading-analysis-display/a59e431724c9ecd70f690d13333a9deb/>PikWizard</a>
</span>
</span>
<span class="image-link">
<span
style="margin: 0 0 20px 0; display: inline-block; vertical-align: middle; width: 100%;"
>
<a
target="_blank"
href="https://pikwizard.com/photo/stock-market-candlestick-chart-trading-analysis-display/a59e431724c9ecd70f690d13333a9deb/"
style="text-decoration: none; font-size: 10px; margin: 0;"
>
<img src="https://pikwizard.com/pw/medium/a59e431724c9ecd70f690d13333a9deb.jpg" style="margin: 0; width: 100%;" alt="" />
<p style="font-size: 12px; margin: 0;">PikWizard</p>
</a>
</span>
</span>
Free (free of charge)
Free for personal and commercial use.
Author: AI Creator
Similar Free Stock Images

Premium


Premium


Premium


Premium


Premium


Premium


Premium


Premium


Premium


Premium


Premium


Premium


Premium


Premium


Premium


Premium


Premium


Premium


Premium


Premium


Premium


Premium


Premium


Premium