- Home >
- Stock Photos >
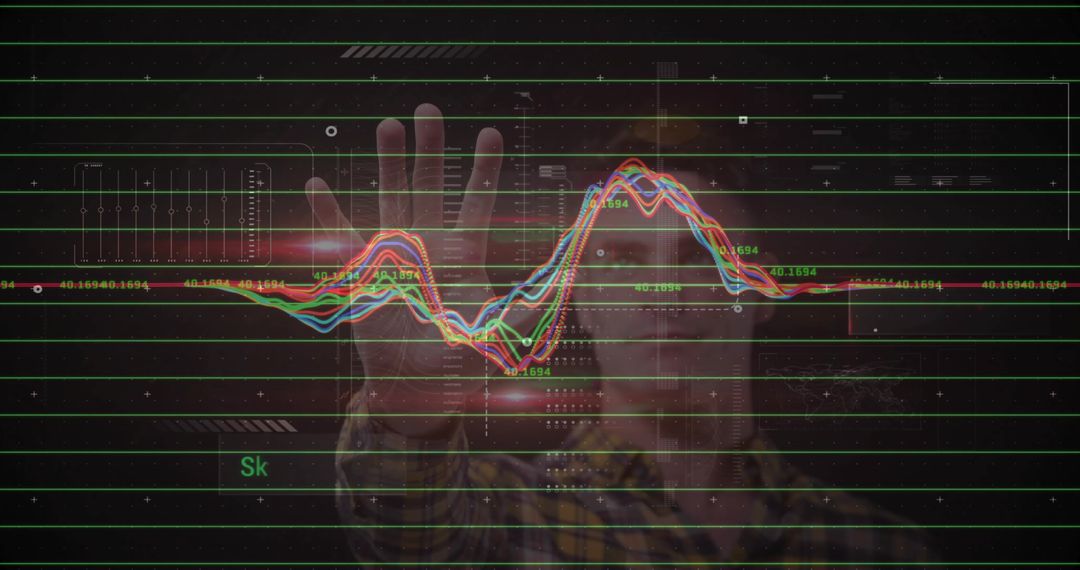
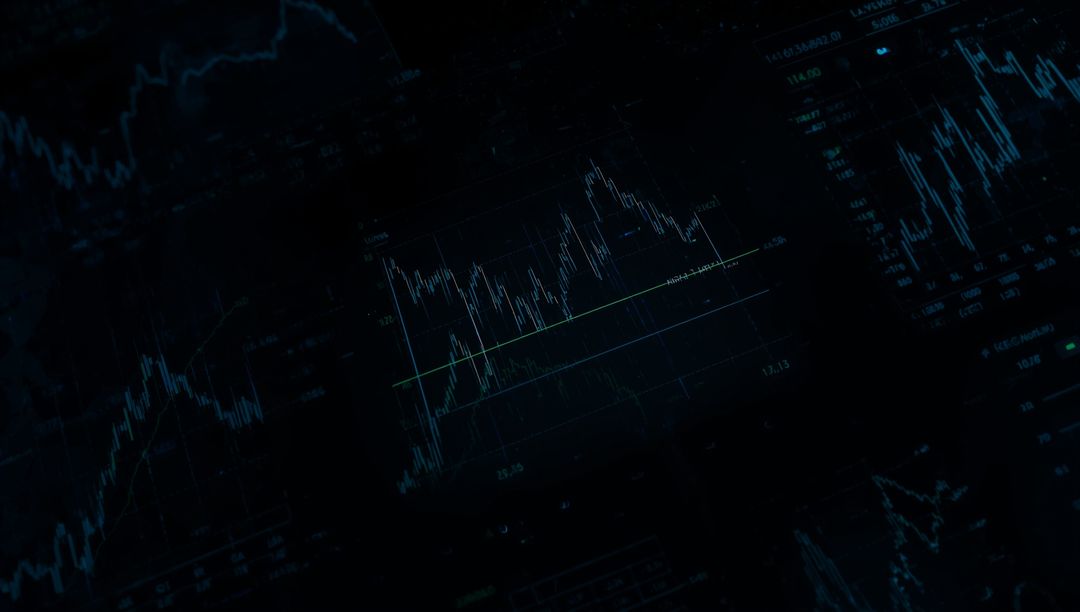
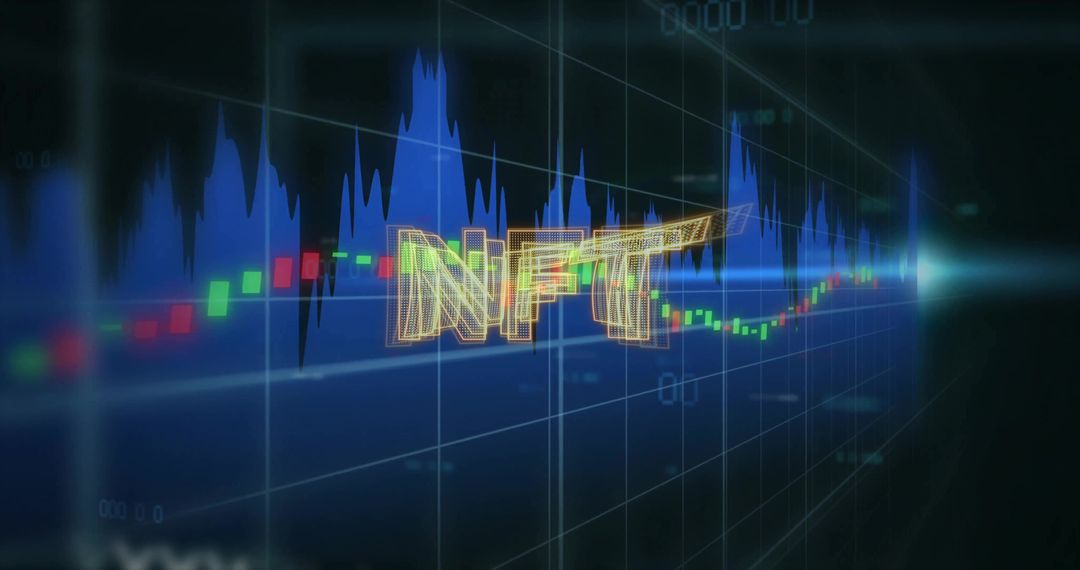
- Stock Market Data on Digital Screen with Blurred Bokeh Lights
Stock Market Data on Digital Screen with Blurred Bokeh Lights Image

AI Generated Image. This scene captures a detailed view of stock market data juxtaposed against a dark digital screen illuminated by numbers and glowing bokeh lights. These visuals create a sense of dynamic movement reminiscent of active trading sessions. Ideal for backgrounds in presentations, financial reports, or articles discussing trading, market analysis, or finance-related topics, this imagery conveys advanced technology and modern corporate analytics.
Powered by  - Get 15% off with code: PIKWIZARD15


0
downloads
downloads
Tags:
More
Credit Photo
If you would like to credit the Photo, here are some ways you can do so
Text Link
photo Link
<span class="text-link">
<span>
<a target="_blank" href=https://pikwizard.com/photo/stock-market-data-on-digital-screen-with-blurred-bokeh-lights/2fca574c97c2d9998b34b2c8e09e712b/>PikWizard</a>
</span>
</span>
<span class="image-link">
<span
style="margin: 0 0 20px 0; display: inline-block; vertical-align: middle; width: 100%;"
>
<a
target="_blank"
href="https://pikwizard.com/photo/stock-market-data-on-digital-screen-with-blurred-bokeh-lights/2fca574c97c2d9998b34b2c8e09e712b/"
style="text-decoration: none; font-size: 10px; margin: 0;"
>
<img src="https://pikwizard.com/pw/medium/2fca574c97c2d9998b34b2c8e09e712b.jpg" style="margin: 0; width: 100%;" alt="" />
<p style="font-size: 12px; margin: 0;">PikWizard</p>
</a>
</span>
</span>
Free (free of charge)
Free for personal and commercial use.
Author: AI Creator
Similar Free Stock Images

Premium


Premium


Premium


Premium


Premium


Premium


Premium


Premium


Premium


Premium


Premium


Premium


Premium


Premium


Premium


Premium


Premium


Premium


Premium


Premium


Premium


Premium


Premium


Premium