- Home >
- Stock Photos >
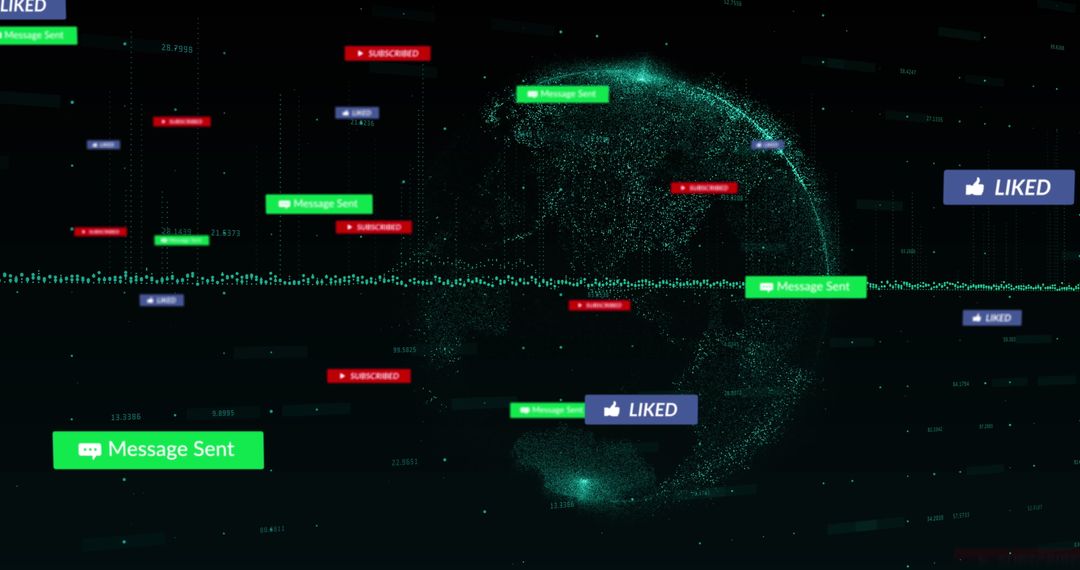
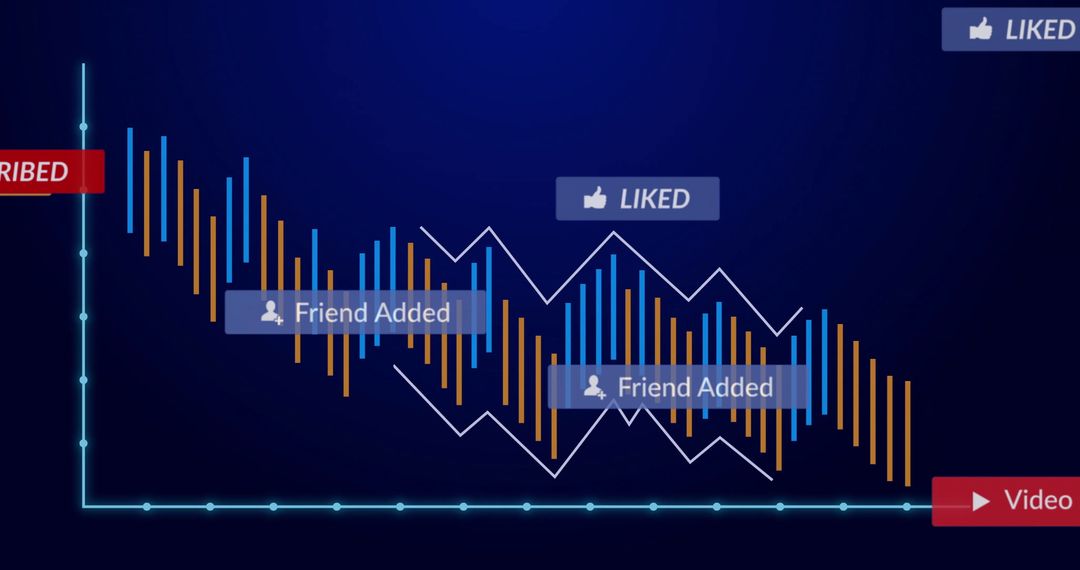
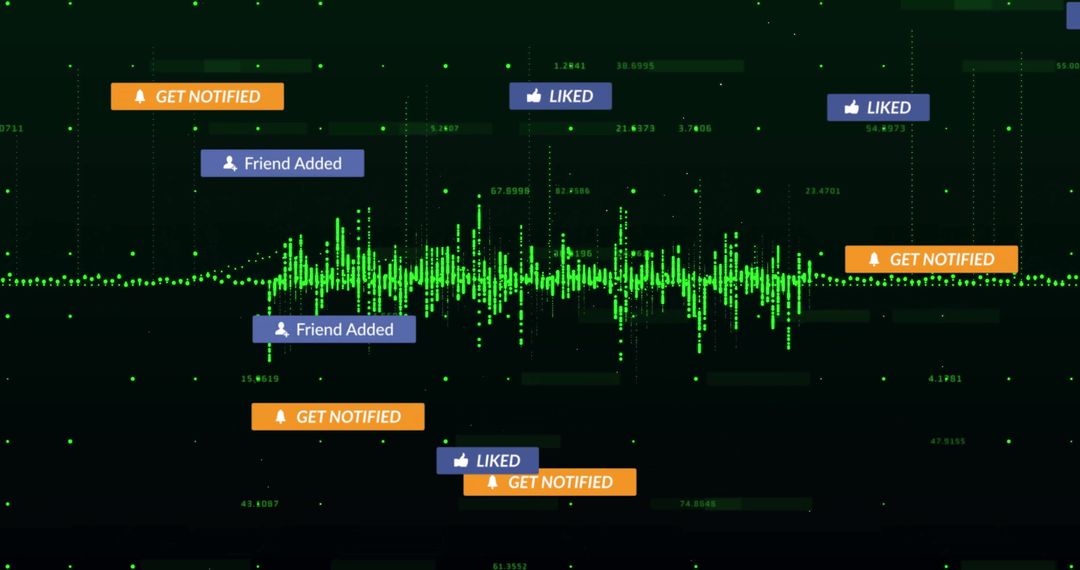
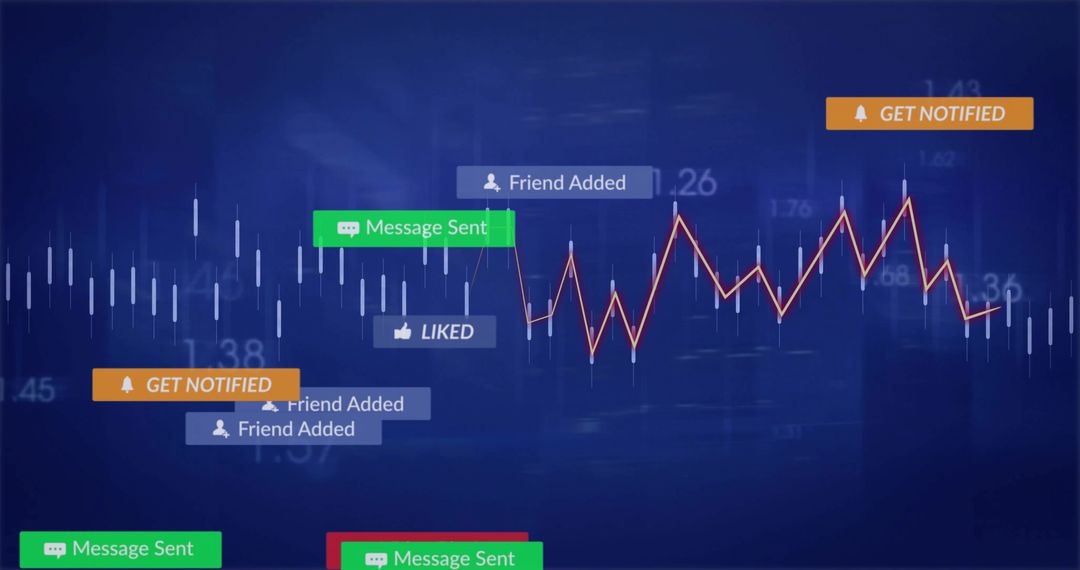
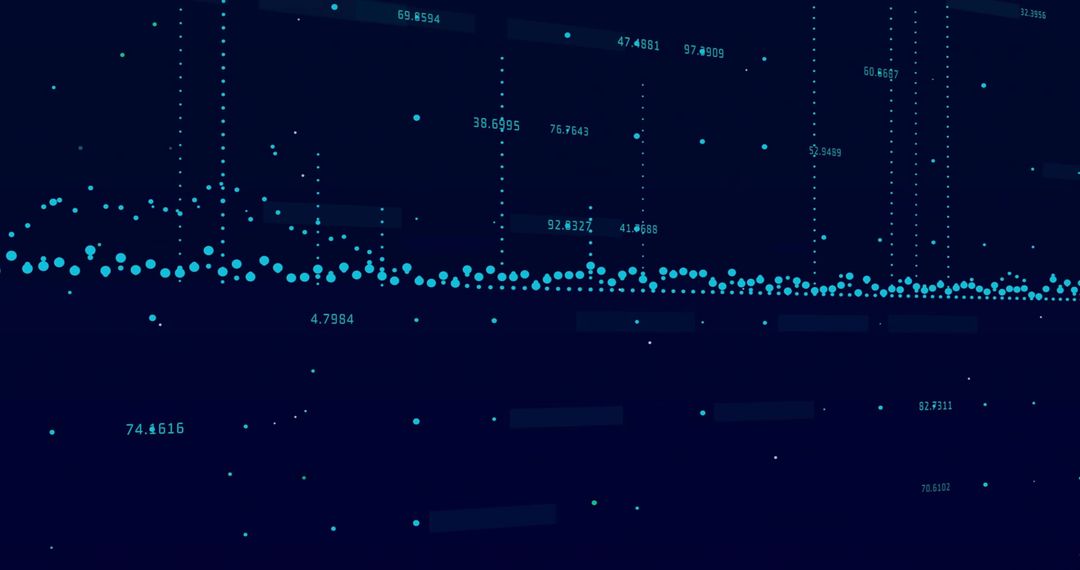
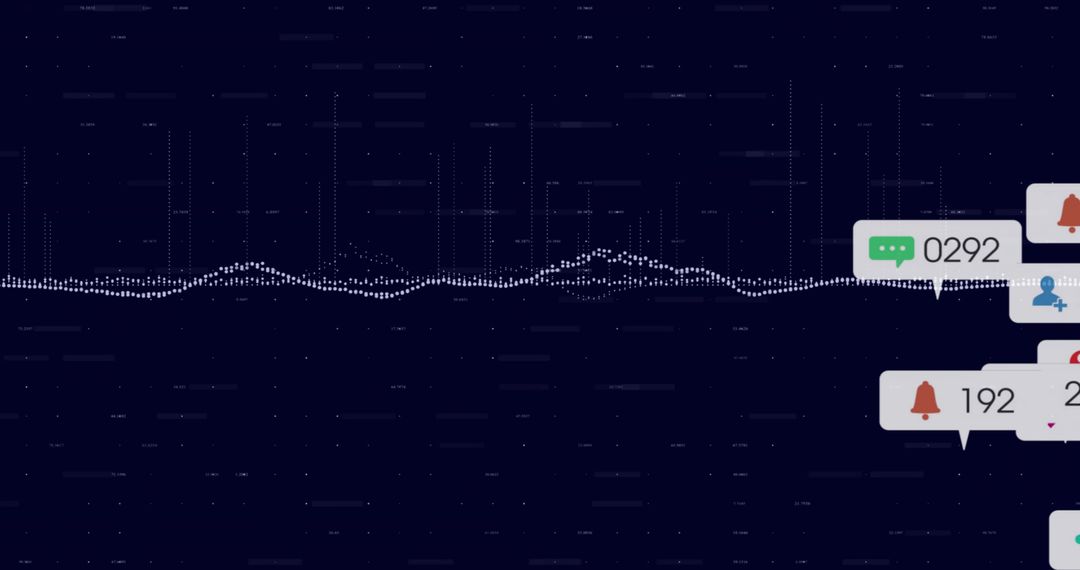
- Streaming cyan data points on modern analytics highlighting social engagement notifications
Streaming cyan data points on modern analytics highlighting social engagement notifications Image
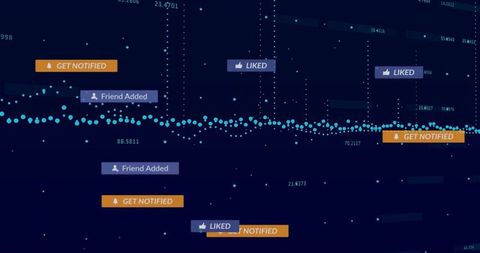
Streaming cyan data points across dark navy analytics canvas with floating notification badges reading GET NOTIFIED, LIKED, Friend Added. Visual composition featuring rhythmic dot graph, subtle numeric markers, and contrasting orange callouts for notification elements. Color palette using deep navy, bright cyan, muted purple tags, and orange accents creating high-tech, minimalist atmosphere. Ideal for web hero banners, SaaS landing pages, product dashboards, social media marketing, UX/UI case studies, and presentation slides about engagement analytics. Use as background for pitch decks, blog headers, newsletter visuals, explainer videos, and marketing reports. Suitable for themes including social engagement, real-time analytics, user growth, notification systems, digital strategy, and interface design.
Powered by  - Get 15% off with code: PIKWIZARD15


0
downloads
downloads
Tags:
More
Credit Photo
If you would like to credit the Photo, here are some ways you can do so
Text Link
photo Link
<span class="text-link">
<span>
<a target="_blank" href=https://pikwizard.com/photo/streaming-cyan-data-points-on-modern-analytics-highlighting-social-engagement-notifications/3fc624f228250409ba556bc1268a283f/>PikWizard</a>
</span>
</span>
<span class="image-link">
<span
style="margin: 0 0 20px 0; display: inline-block; vertical-align: middle; width: 100%;"
>
<a
target="_blank"
href="https://pikwizard.com/photo/streaming-cyan-data-points-on-modern-analytics-highlighting-social-engagement-notifications/3fc624f228250409ba556bc1268a283f/"
style="text-decoration: none; font-size: 10px; margin: 0;"
>
<img src="https://pikwizard.com/pw/medium/3fc624f228250409ba556bc1268a283f.jpg" style="margin: 0; width: 100%;" alt="" />
<p style="font-size: 12px; margin: 0;">PikWizard</p>
</a>
</span>
</span>
Free (free of charge)
Free for personal and commercial use.
Author: Creative Art
Similar Free Stock Images

Premium


Premium


Premium


Premium


Premium


Premium


Premium


Premium


Premium


Premium


Premium


Premium


Premium


Premium


Premium


Premium


Premium


Premium


Premium


Premium


Premium


Premium


Premium


Premium